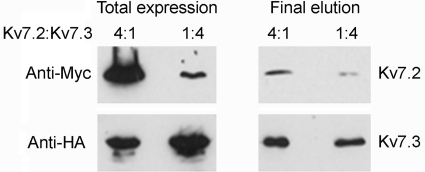
FIGURE 5.
Effect of varying relative subunit expression levels on the subunit composition of the Kv7.2/Kv7.3 heteromer. tsA 201 cells were cotransfected with DNA encoding Kv7.2 and Kv7.3 in ratios of 4:1 and 1:4. Protein was isolated from the cells by sequential capture on anti-HA and anti-Myc immunobeads, resulting in the isolation of heteromers. The left panels show total cell extracts. The right panels show the final eluates from the immunobeads. The protein concentrations in the two eluates were adjusted to produce bands of approximately equal intensity on the anti-HA (Kv7.3) immunoblot. Immunoreactive bands were visualized using a horseradish peroxidase-conjugated goat anti-mouse secondary antibody followed by enhanced chemiluminescence.

