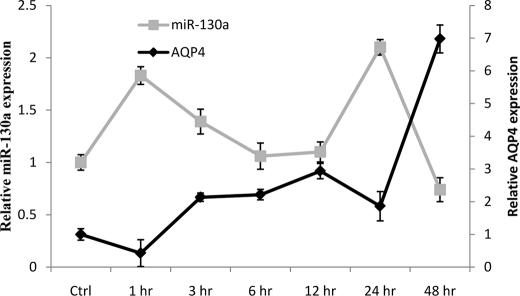
FIGURE 7.
miR-130a and AQP4 profile in ischemic rat models. The opposing expression patterns of miR-130a and AQP4 in ischemic rat models are shown. Changes in miR-130a and AQP4 expression levels in the brain samples were quantitated using stem-loop qRT-PCR and qRT-PCR, respectively. All values were expressed relative to control (Ctrl) rats. Error bars represent the mean ± S.E. (n = 3).

