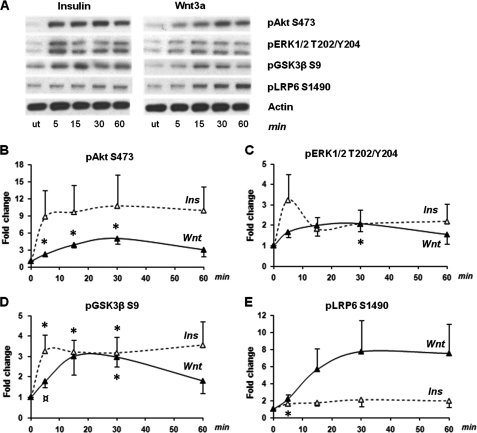
FIGURE 1.
Insulin and Wnt phosphorylation time courses in 3T3-L1 preadipocytes. Preadipocytes were treated with either 100 nm insulin (Ins) or 75 ng/ml Wnt3a in parallel at various time points for 60 min. A, representative Western blots and phosphorylation levels of Akt (serine 473), ERK1/2 (threonine 202 and tyrosine 204), GSK3β (serine 9), and LRP6 (serine 1490). B–E, band intensities were determined using the Image J software, and fold changes compared with untreated cells were calculated for all proteins. The error bars show S.E. (n = 3). * indicates a p value < 0.05 for basal versus stimulated values. ¤ indicates a p value < 0.06 for basal versus stimulated values. Total protein levels for each insulin and Wnt3a time point can be seen in supplemental Fig. S1. ut, untreated.

