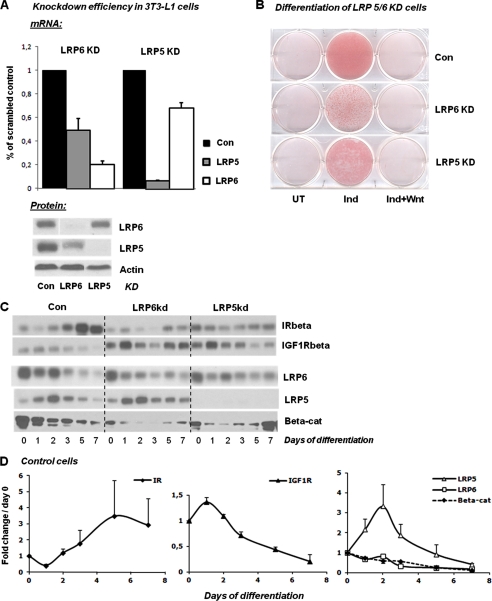
FIGURE 3.
Knockdown efficiency and adipocyte differentiation of control, LRP5 KD, and LRP6 KD cells. Knockdown cell lines were created as stated under “Experimental Procedures” using a lentiviral shRNA approach. A control cell line, expressing a shRNA with a scrambled sequence, was created in parallel with the KD cells and is labeled Con. A, mRNA and protein levels of LRP5 and LRP6 in 3T3-L1 LRP5 and LRP6 KD preadipocytes as observed immediately after puromycin withdrawal (n = 2). B, the level of differentiation was determined for each cell line by oil red O staining at day 7 in untreated cells (UT), the cells were given a standard induction mixture (Ind), and the cells were given the induction mixture plus Wnt3a at 75 ng/ml (Ind+Wnt). C, protein levels of receptors and β-catenin were determined by Western blotting at different days of differentiation in all cell lines. D, band intensities for protein levels in control cells were determined using the Image J software, and fold changes compared with day 0 were calculated (n = 2). The error bars show S.D. Con, control; UT, untreated; Beta-cat, β-catenin.

