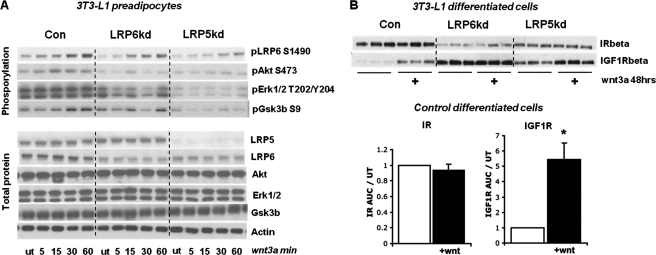
FIGURE 5.
Wnt signaling in LRP5 and LRP6 KD preadipocytes and regulation of the insulin/IGF-1 signaling system. A, all of the 3T3-L1 cell lines were treated with 75 ng/ml Wnt3a for various times for 60 min, and the phosphorylation response was determined by Western blot analysis (n = 3). B, differentiated 3T3-L1 cells were grown with or without Wnt3a (75 ng/ml) added to the medium for 48 h. The proteins were extracted and subjected to Western blot analysis for IR and IGF1R levels. The error bars show S.E. (n = 3). Con, control; ut, untreated.

