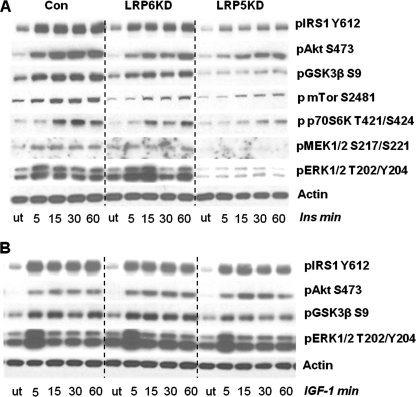
FIGURE 6.
Insulin and IGF-1 signaling in LRP5 and LRP6 KD preadipocytes. 3T3-L1 preadipocytes were stimulated with 100 nm insulin or IGF-1 at various time points for 60 min. Total cell extracts were made and used directly for Western blot analysis. A, the insulin phosphorylation response of proteins in the insulin signaling pathway (n = 3). B, the IGF-1 phosphorylation response of proteins in the insulin signaling pathway (n = 3). Total protein levels for the various insulin time points can be seen in supplemental Fig. S4. Con, control; ut, untreated.

