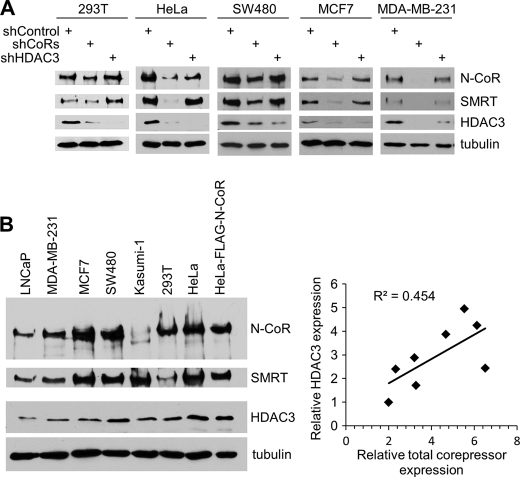
FIGURE 6.
Corepressor expression generally correlates with HDAC3 protein level in multiple cell types. A, Western blot analysis of indicated proteins expressed in cells following control knockdown, corepressor knockdown, or HDAC3 knockdown. B, Western blot analysis of N-CoR, SMRT, and HDAC3 expression in the cell lines indicated. The level of expression was quantified by densitometry and NIH ImageJ software. Relative expression, after normalization to the expression observed in LNCaP cells, is shown in the supplemental Table S1. The bottom right panel shows a scatter plot between relative HDAC3 expression and the overall level of corepressor expression (N-CoR, SMRT). The squared correlation coefficient (R2) is shown.

