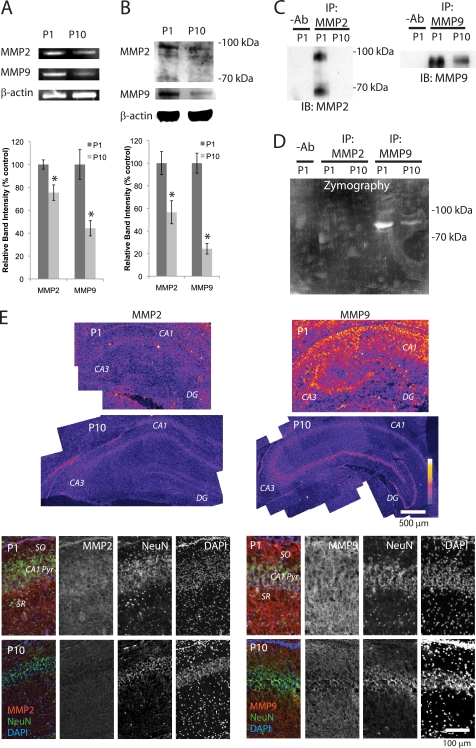
FIGURE 1.
Levels of MMP2 and MMP9 decrease during the first 10 postnatal days. A, RT-PCR analyses of MMP2 and MMP9 in P1 and P10 hippocampi. β-Actin was used as a control (n = 4). Means ± S.E. are plotted. Asterisk, p < 0.0001 (Student's t test). B, Western blot analyses of MMP2 and MMP9 in P1 and P10 hippocampi. β-Actin was used as a control (n = 4). Means ± S.E. are plotted. Asterisk, p < 0.0001 (Student's t test). C, immunoprecipitation (IP) of MMP2 and MMP9 from P1 and P10 hippocampi. −Ab, homogenate from P1 hippocampi was incubated with protein-A agarose without antibody. IB, immunoblot. D, gel zymography of MMP2 and MMP9 immunoprecipitated from P1 and P10 hippocampi. E, immunostaining of MMP2 and MMP9. Upper panel, P1 and P10 hippocampi. Fluorescence intensity is represented by a color scale. Lower panel, CA1 regions from P1 and P10 are shown. MMP2 or MMP9 (red); the neuronal marker protein NeuN (green); and DAPI nuclear stain (blue).

