FIGURE 2.
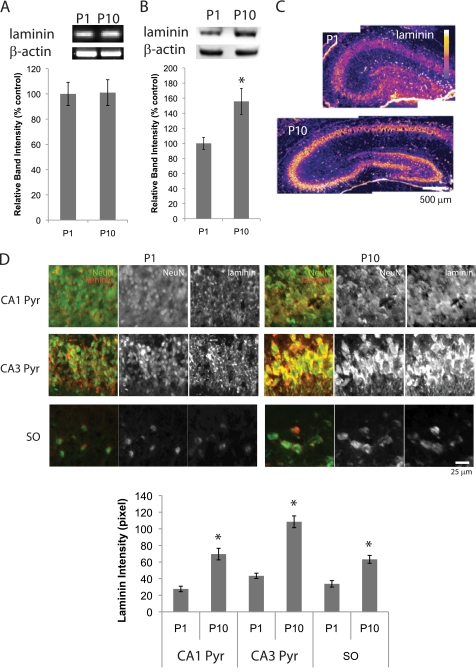
Levels of laminin increase during the first 10 postnatal days. A, RT-PCR analyses of laminin β1 chain. Graph shows relative band intensities of laminin β1 chain standardized against β-actin bands (n = 4). Means ± S.E. are plotted. B, Western blot analyses of laminin in P1 and P10 hippocampal tissue. Graph shows relative band intensities of laminin standardized against β-actin bands (n = 4). Means ± S.E. are plotted. Asterisk, p < 0.0001 (Student's t test). C, immunostaining of laminin. P1 and P10 hippocampi. Fluorescence intensity is represented by a color scale. D, immunostaining of laminin (red) and NeuN (green). Top, CA1 and CA3 pyramidal cell layers, and CA1 SO neurons of P1 and P10 hippocampi. Bottom, intensities of laminin immunostaining. Pyramidal cell layer and soma region of SO interneurons were determined using NeuN staining. Fluorescent intensity of laminin staining from NeuN− region was subtracted to plot laminin intensities (n = 5; means ± S.E.). Asterisks, p < 0.001 (Student's t test).

