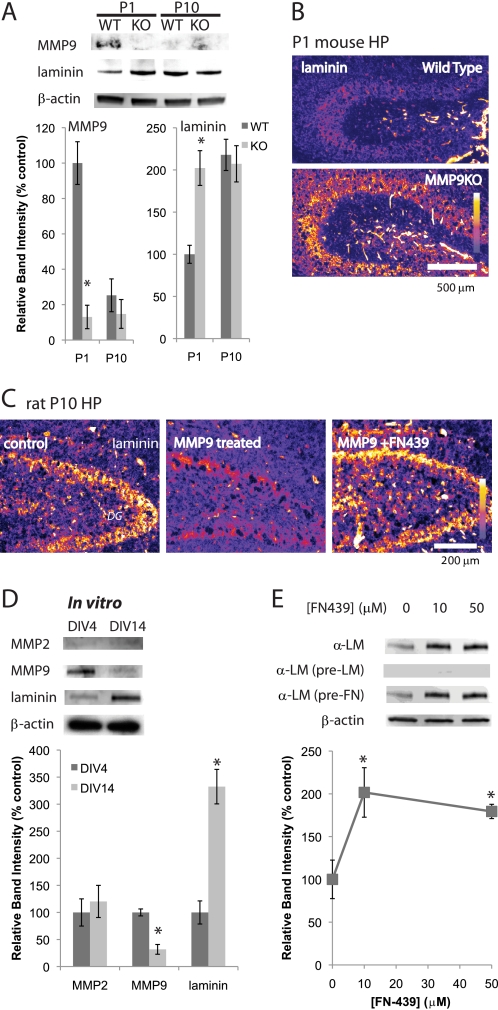
FIGURE 3.
MMP9 and laminin are developmentally regulated in vitro. A, Western blot analyses of MMP9 and laminin in the wild type and MMP9KO mouse hippocampus. C, cleavage of laminin by rrMMP9. Immunostaining of laminin in P10 dentate gyrus region is shown. Fluorescence intensity is represented by a color scale. Samples were incubated with 10 ng/ml rrMMP9 at 37 °C for 24 h. 50 μm FN-439 was used. Graph shows relative band intensities standardized against β-actin bands (n = 4). Means ± S.E. were plotted. Asterisk, p < 0.0001 (Student's t test). B, immunostaining of laminin. P1 hippocampi of wild type (top panel) and MMP9KO (bottom panel) mice. Fluorescence intensity is represented by a color scale. D, Western blot analyses of MMP2, MMP9, and laminin, comparing expression in DIV4 and DIV14. β-Actin was used as a loading control. Graph shows relative band intensities standardized against β-actin bands (n = 4). Means ± S.E. were plotted. Asterisk, p < 0.0001 (Student's t test). E, Western blot analysis shows laminin expression is regulated by MMPs. Neurons were cultured with 0, 10, or 50 μm FN-439 from DIV4 to DIV6. Western blot was performed using laminin antibody (α-LM), laminin-pre-absorbed laminin antibody (α-LM (pre-LM)), or fibronectin-pre-absorbed laminin antibody (α-LM (pre-FN)). β-Actin was used as a loading control. Analyses were done using the same membrane repeatedly stripped by 100 mm glycine-HCl, pH 2.5, and reprobed. Graph shows relative band intensities standardized against β-actin bands (n = 4). Means ± S.E. are plotted. Asterisk, p < 0.0001 (one-way ANOVA).

