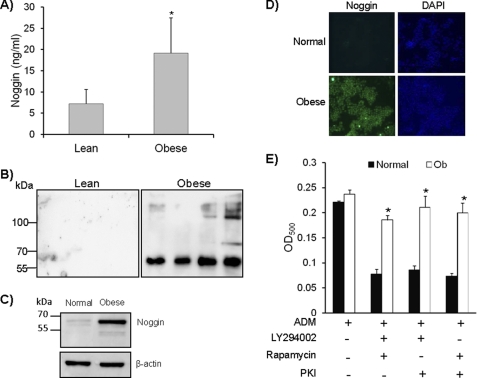
FIGURE 3.
Noggin levels are elevated in obese individuals and obese mice. A, plasma samples from lean individuals (BMI < 27) and obese individuals (BMI > 27) were used to detect the levels of noggin using a commercially available ELISA kit (n = 25; p = 0.008). B, a Western blot for detecting presence of noggin was carried out on lean and obese plasma samples using anti-mouse Noggin antibody (n = 25). C, MSC were isolated from BM of obese mice. Cell lysates were prepared from both normal and obese mice MSC, and noggin expression was by Western blot using anti-noggin antibody. A representative blot is presented here (n = 3). D, MSC from normal and obese (Ob) mice were grown on chamber slides and stained using anti-noggin antibody followed by FITC-labeled secondary antibody to detect the presence of noggin inside the cells. A representative image from each sample is shown here. Nuclei were stained using DAPI. Magnification is 200× (n = 3). E, MSC from the obese mice were cultured in the presence of inhibitors for adipocyte differentiation. Adipocytes were detected as mentioned before. The experiment was repeated three times (n = 3; *, p < 0.05).

