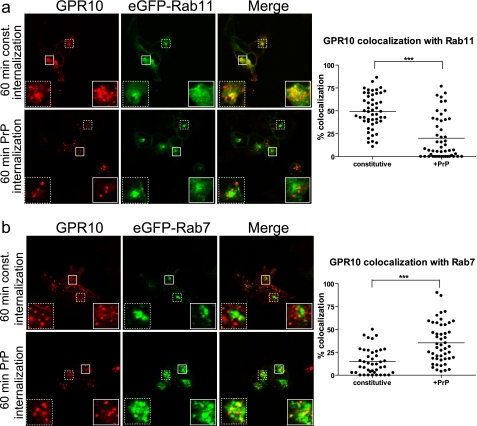
FIGURE 2.
Agonist-induced internalization of GPR10 by PrP redirects endocytic sorting away from Rab11-positive pathway toward Rab7-positive pathway. a, left, confocal laser scanning micrographs of HEK293 cells transiently expressing GPR10 and GFP-Rab11. Cells were surface-labeled with Alexa Fluor 568-conjugated anti-FLAG M1 antibody at 4 °C to label GPR10 before 60 min of constitutive (const.) internalization at 37 °C (top panel) or 60 min of agonist-induced internalization (1 nm PrP) (lower panel) at 37 °C. The GPR10 signal is shown in red, and the eGFP-Rab11 signal is in green. Small white squares mark areas that are shown enlarged inside large white squares. Right, quantification of colocalization between internalized GPR10 and eGFP-Rab11 after 60 min of constitutive (n = 52) and agonist-induced internalization (n = 52). Each dot represents a single cell, and horizontal bars indicate means. ***, p < 0.001, unpaired t test. Data were collected on three separate experimental days. b, left, confocal laser scanning micrographs of HEK293 cells expressing eGFP-Rab7 and GPR10. Cells were surface-labeled with Alexa Fluor 568-conjugated anti-FLAG M1 antibody at 4 °C to label GPR10 before 60 min of constitutive internalization at 37 °C (top panel) or 60 min of agonist-induced internalization (1 nm PrP) (lower panel) at 37 °C. The GPR10 signal is shown in red, and the eGFP-Rab7 signal is in green. Small white squares mark areas that are shown enlarged inside large white squares. Right, quantification of colocalization between internalized GPR10 and eGFP-Rab7 after 60 min of constitutive (n = 42) and agonist-induced internalization (n = 50). Each dot represents a single cell, and horizontal bars indicate means. ***, p < 0.001, unpaired t test. Data were collected on three separate experimental days.

