FIGURE 3.
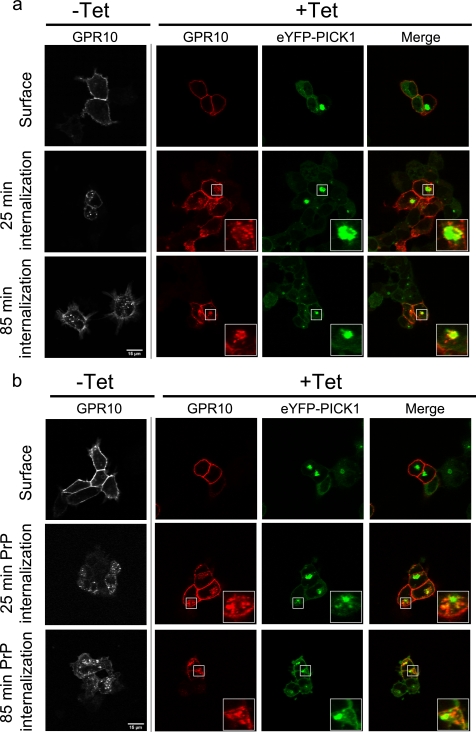
Constitutively internalized GPR10 co-clusters with eYFP-PICK1 in contrast to GPR10 internalized by agonist stimulation. a, confocal laser scanning micrographs of Flp-In T-REx 293 eYFP-PICK1 cells transiently expressing GPR10. The pictures show constitutive internalization of GPR10 that was surface-labeled with Alexa Fluor 568-conjugated anti-FLAG antibody at 4 °C without tetracycline (−Tet) and with (+Tet) induced expression of eYFP-PICK1 (green) prior to constitutive internalization for 25 or 85 min at 37 °C. Panels starting from the left show the GPR10 signal in non-induced cells, GPR10 signal in tetracycline-induced cells (red), eYFP-PICK1 signal (green), and merge of the red and green signals. b, confocal laser scanning micrographs of Flp-In T-REx 293 eYFP-PICK1 cells transiently expressing GPR10. The pictures show agonist-induced internalization of GPR10 that was surface-labeled with Alexa Fluor 568-conjugated anti-FLAG M1 antibody at 4 °C without (−Tet) and with (+Tet) induced expression of eYFP-PICK1 (green). Internalization was stimulated by agonist treatment (1 nm PrP) for 25 or 85 min at 37 °C. Panels starting from the left show the GPR10 signal in non-induced cells, GPR10 signal in tetracycline-induced cells (red), eYFP-PICK1 signal (green), and merge of red and green signals. Representative images are shown from ∼15 cells visualized per condition in each experiment and over three separate experiments. The small squares mark areas that are shown enlarged inside the large squares. Scale bars, 15 μm.

