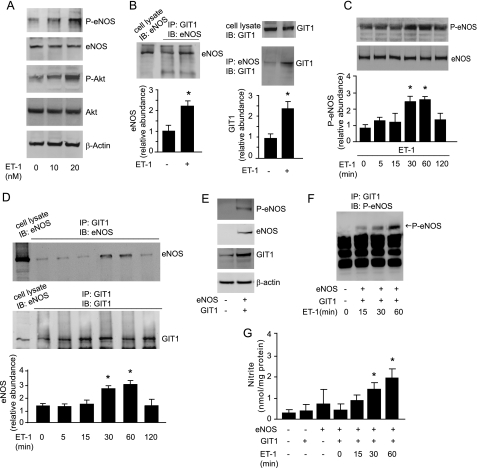
FIGURE 7.
Agonist stimulation of GIT1 and eNOS interaction. A, sinusoidal endothelial cells were exposed to ET-1 (10 to 20 nm) for 1 h, and cell lysates were subjected to immunoblotting (IB) with the indicated antibodies. B, cells were exposed to ET-1 (10 nm) for 1 h, and cell lysates were subjected to immunoprecipitation (IP) with antibody to GIT1 (left panel) or eNOS (right panel) and immunoblotted with antibody to eNOS or GIT1; specific eNOS or GIT1 bands were quantitated and normalized to the level of immunoprecipitated GIT1 or eNOS and presented in the graph in the lower panel (n = 3, *, p < 0.05 versus no ET-1). The expression of eNOS or GIT1 from 10% of the total cell lysate used for immunoprecipitation is also shown (left panel, left band, and right top panel). C and D, cells were exposed to ET-1 (10 nm) from 0 to 120 min. C, cell lysates were subjected to immunoblotting to detect phospho-eNOS or total eNOS (upper panel); specific phospho-eNOS bands are depicted graphically (lower panel, n = 3, *, p < 0.01 compared with time “0”). D, GIT1 or eNOS from the same cells as in C was immunoprecipitated and the presence of associated eNOS or GIT1 protein was assessed by immunoblotting (upper panel) and specific eNOS bands were quantified and normalized to the level of immunoprecipitated GIT1 (lower panel, n = 3, *, p < 0.05 compared with time 0). In E–G, NIH 3T3 cells were co-transfected with GIT1 or eNOS as indicated. E, cell lysates were subjected to immunoblotting with the indicated antibodies. F and G, NIH 3T3 cells were stimulated with ET-1 for the indicated times, GIT1 was immunoprecipitated and the presence of phospho-eNOS protein was assessed by immunoblotting (F) and conditioned medium was collected and nitrite levels were measured (G, n = 3, *, p < 0.01 compared with no ET-1 or to time 0).

