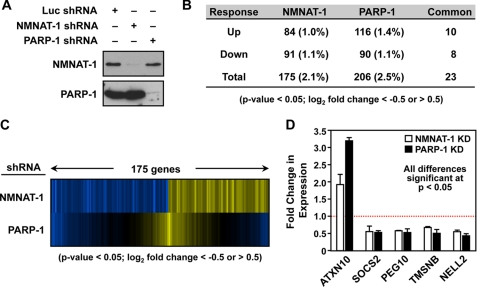
FIGURE 3.
Regulation of gene expression by NMNAT-1 and PARP-1 in MCF-7 cells. A, stable knockdown of NMNAT-1 and PARP-1 in MCF-7 cells using shRNA constructs with an shRNA targeting luciferase (Luc) as a control. NMNAT-1 and PARP-1 protein levels were determined by Western blot analyses. B, number of genes significantly affected by NMNAT-1 or PARP-1 knockdown in MCF-7 cells as determined by expression microarray analysis. The genes were selected using a two-tailed Student's t test (p value <0.05) and a -fold change cutoff (log2 -fold change <−0.5 or >0.5). Numbers in parentheses indicate the percentage of all expressed genes. Each gene set is divided into up- and down-regulated groups. Note that five genes in the overlapping set of 23 genes are differentially regulated by NMNAT-1 and PARP-1. C, expression profiles of genes affected by NMNAT-1 or PARP-1 knockdown in MCF-7 cells. The genes affected by NMNAT-1 knockdown were selected as described in B. The corresponding signals for the PARP-1 knockdown condition for the same genes are also shown. D, RT-qPCR confirmation of expression microarray data for a subset of target genes affected by NMNAT-1 and PARP-1 knockdown (KD) in a similar manner. The bars shown in D represent the mean of three or four independent experiments, and the error bars represent S.E. Statistical significance was determined by two-tailed Student's t test with a p value <0.05.

