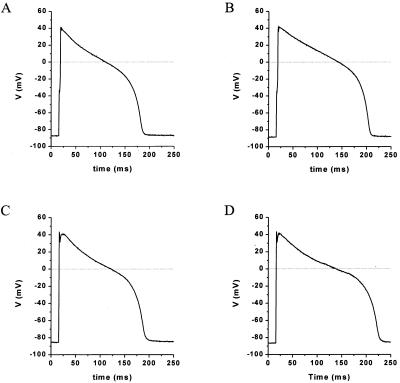
Figure 3.
Original action potential recordings of a HERG-G628S-infected myocyte at 0.5 Hz (D) and 2 Hz (C) compared with a control cell at 0.5 Hz (B) and 2 Hz (A) demonstrate that the rate-dependent increase in APD was not significantly different between the mutant and the control. Action potential duration at 0.5 Hz was not significantly longer in HERG-G628S-infected myocytes than in the noninfected cells.

