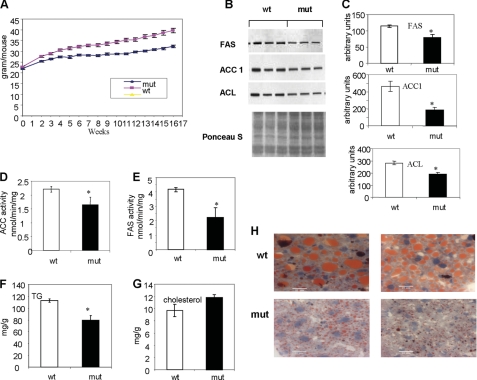
FIGURE 3.
Body weights, representative Western blots, enzyme activities of ACC and FAS, and levels of TGs and cholesterol in samples of liver extracts from control and Acc2−/− mutant mice fed a high-fat, high-carbohydrate diet. A, body weights of 5-week-old male mice fed a high-fat, high-carbohydrate diet for 16 weeks (n = 20). B–H, represent data from 3–4-month-old male mice fed a high-fat, high-carbohydrate diet for 2 months. B and C, representative Western blots of liver extracts and the quantification of the respective bands as described for Fig. 2. For detection of ACC, we used ACC1 antibodies, as we described previously (3). D and E, enzyme activities of ACC and FAS, respectively. F and G, levels of TGs and cholesterol in liver extracts, as determined by enzymatic methods. H, Oil Red O staining of frozen liver tissues showing the accumulation of oil droplets in orange; the bar indicates 20 μm.

