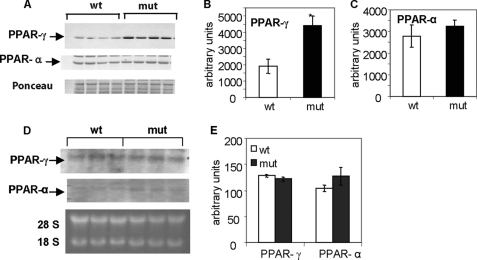
FIGURE 8.
Levels of transcription factors PPAR-γ and PPAR-α in liver extracts of control and Acc2−/− mutant mice under fasted-refed (FRFD) conditions. A, representative Western blots for PPAR-γ and PPAR-α as indicated by arrows. Bottom panel shows a representative blot stained with Ponceau S as a control for equal loading. B and C, scanned values of PPAR-γ and PPAR-α, respectively. D, representative Northern blot of total RNA, which was electrophoresed on a 1% agarose gel in the presence of formalin and transferred to Hybond N filters. The filters were hybridized with 32P-labeled cDNA probes of PPAR-γ and PPAR-α. Bottom panel shows an ethidium bromide-stained agarose gel for control of equal loading; the ribosomal RNA 28 S and 18 S are indicated. E, scanned values of the PPAR-γ and PPAR-α bands. Data are expressed as mean ± S.D. (n = 5; *, p < 0.05).

