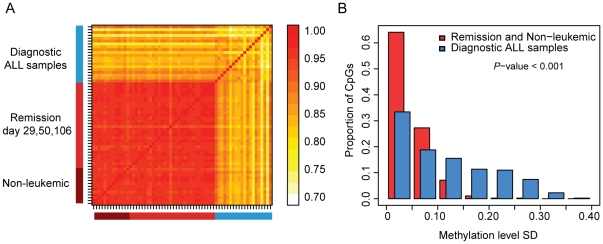
Figure 1. Correlation matrix and variability of the methylation levels measured at 1,320 CpG sites across the 63 samples included in the study.
(A) Each individual sample is indicated by a black line on the axes. The methylation levels in the samples taken at remission during induction therapy at day 29 and during consolidation therapy at days 50 and 106 are highly correlated with the methylation levels in the non-leukemic samples (median Pearson's correlation coefficient (R) = 0.96), while the diagnostic ALL samples are less similar both to each other and to the samples taken after treatment, and to the non-leukemic samples (median R = 0.83). The scale for the correlation coefficients is shown to the right of the matrix. The red color indicates higher correlation (greater similarity), while the light yellow indicates less correlation (less similarity). (B) Histograms of the standard deviations (SD) for the methylation levels measured for 1,320 CpG sites across 20 ALL samples (blue) and across the combined 33 remission samples and 13 non-leukemic controls (red). SD bins are shown on the horizontal axis. The vertical bars show the proportion of observations in each SD bin. The CpG sites show greater variability in the ALL samples than in the remission samples and non-leukemic controls (Wilcoxon Rank-Sum P<0.001).

