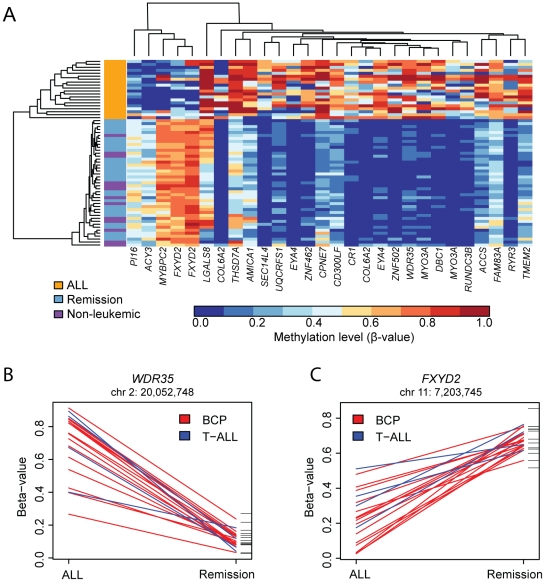
Figure 2. Differential methylation in ALL cells.
(A) Heatmap of the methylation profiles of the 28 CpG sites that are differentially methylated between the diagnostic ALL samples, bone marrow cells at remission and non-leukemic bone marrow cells. The ALL samples (orange) and bone marrow cells during remission (blue) form two distinct groups. Thirteen bone marrow cell samples from non-leukemic controls (purple) cluster among the samples collected during remission. The scale for the methylation β-values is shown below the heatmap. The elongated heights of the dendrogram branches between the ALL samples compared to the normal samples illustrate the increased variability in the ALL samples for the 28 CpG sites. Graphs showing the differences in methylation level between CpG sites in the (B) WDR35 and (C) FXYD2 genes at the time of diagnosis (left vertical axis) and during remission (right vertical axis). The data points for each paired sample are connected with a red line for B-cell precursor (BCP) samples and with a blue line for T-ALL samples. The corresponding CpG methylation levels in 13 non-leukemic control samples are shown as black horizontal lines to the right of the graphs. The CpG site at chr2:20,052,748 in the WDR35 gene (B) was hypermethylated in diagnostic ALL samples and hypomethylated at remission and in non-leukemic controls, while the CpG site at chr11:7,203,745 in the FXYD2 gene (C) displayed the opposite pattern. The BCP and T-ALL samples display the same pattern of methylation difference in these two genes.

