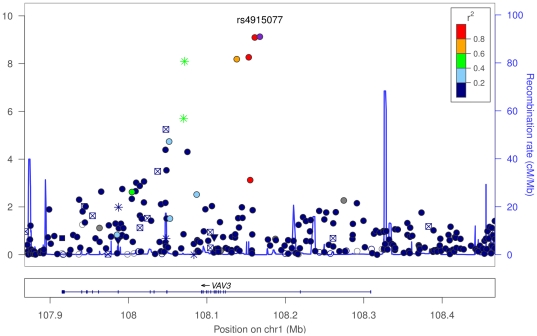
Figure 1. SNPs in the VAV3 region.
In the plot, circles represent unannotated SNPs, upside-down triangles represent non-synonymous variants, and boxes with an “x” are SNPs in regions that are highly conserved across 44 placental mammals. Colors depict the squared correlation ( ) of each SNP with the most associated SNP (i.e., rs4915077, shown in purple). Gray indicates SNPs for which
  information was missing. Plots were produced using the LocusZoom program [50].

