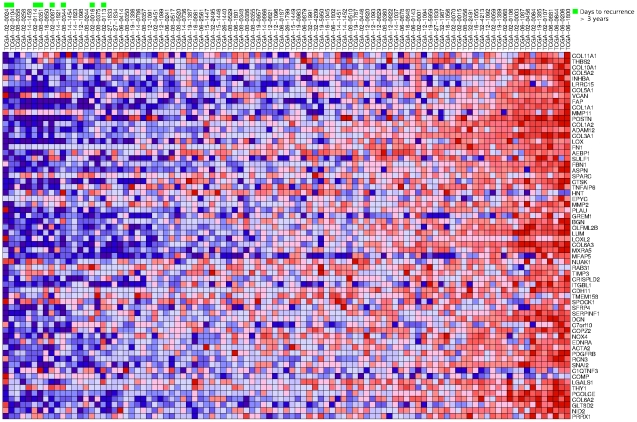
Figure 2. Heat map of the components of the mesenchymal transition metagene in glioblastoma.
The 99 samples are ranked in terms of the average expression level of the genes shown in Table 1. The eight patients for which time to recurrence was more than three years are highlighted in green at the 1st, 2nd, 6th, 7th, 9th, 11th, 16th, and 18th position, resulting in the rank sum of 70.

