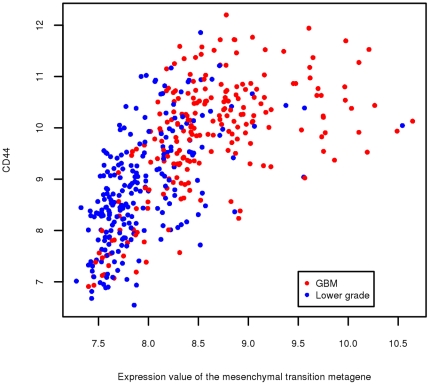
Figure 4. Scatter plot for the expression levels of CD44 vs. the mesenchymal transition metagene.
Each dot in the scatter plot represents a glioma sample from the NCI Repository for Molecular Brain Neoplasia Data (Rembrandt) dataset. Dots are color coded red for glioblastomas and blue for lower grade gliomas. Expression levels are RNA normalized.

