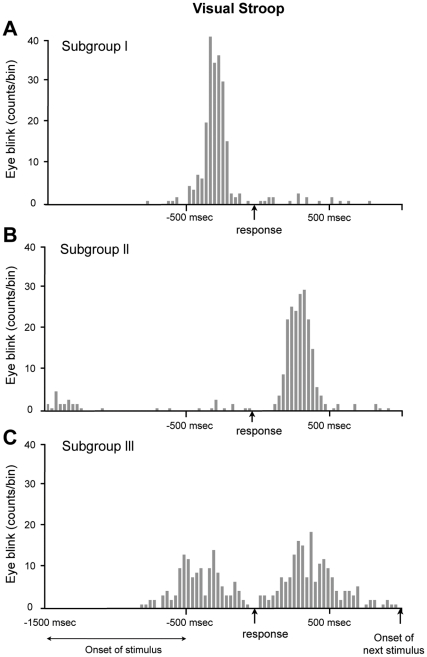
Figure 3. A representative example of a subject from each subgroup.
We classified 28 subjects into 3 subgroups based on the position of the eyeblink peak location. The histogram (having 30 msec intervals) was drawn based on the time difference between the eyeblink and visual response for 240 trials per subject. (A) Subgroup I. The subjects who blinked mostly before the vocal response were classified as belonging to subgroup I. Of the 28 subjects, 17 belonged to this group. The mean number of eyeblinks was 1.1 ± 0.3 blinks/trial and the eyeblinks demonstrated a distribution of 210 ± 85 msec. (B) Subgroup II. The subjects who had a peak location after the vocal response were classified as belonging to subgroup II. Of the 28 subjects, 7 belonged to this group. The mean number of eyeblinks per a trial was 0.9 ± 0.4 blinks/trial and the peak location was 380 msec with standard deviation of 116 msec. (C) Subgroup III. The subjects who blinked both before and after the vocal response were classified as belonging to subgroup III. Of the 28 subjects, 4 belonged to this group. This bimodal distribution was drawn because the subject blinked before the response in one set, but blinked after the response in another set. Relative to subgroups I and II, subgroup III had a lower peak value due to its two different peak locations.

