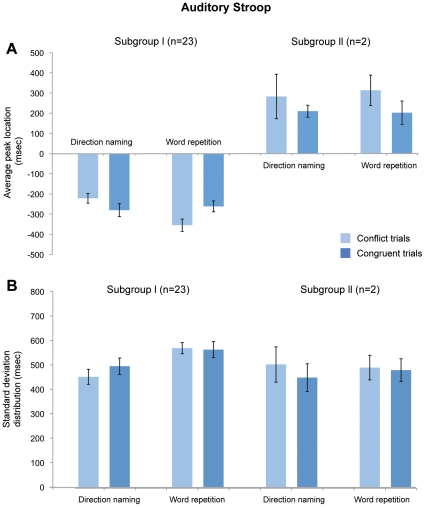
Figure 7. Average peak location and standard deviation distribution for all subjects.
No significant differences were found between the stimulus type and condition as in the visual Stroop task. (A) For the 28 subjects, peak locations were measured in each set, and the mean and standard deviation value across all of the subjects are presented. The total average peak location is the mean value of the subject’s entire set of peak values and is measured from the 30 msec interval histogram, which consists of 120 trials. The conflict and congruent average peak location is a subset of the total average peak location that is derived from each stimuli, which consists of 60 trials. (B) The standard deviation distribution is the mean value of the standard deviation from the peak value in each subject with error bars showing standard errors across all of the subjects.

