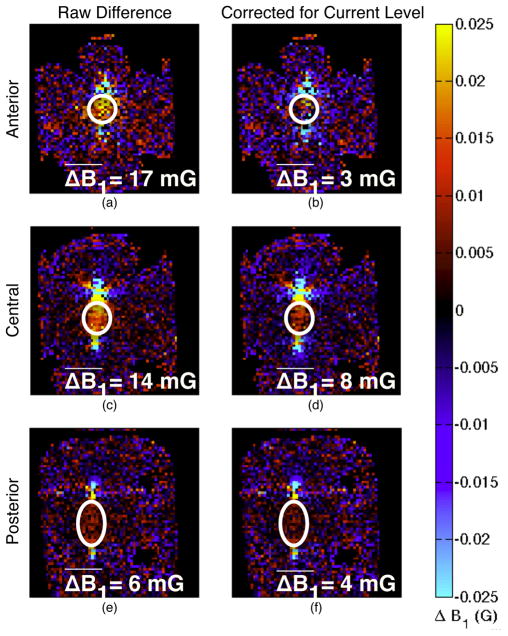
Fig. 10.
Change in coronal B1 maps from ablation. The images in the left column (a, c, and e) are the raw difference in the post-ablation images from the pre-ablation images, with red and yellow tinted regions indicating higher fields after ablation. The differences are quantified by taking the mean of the difference in a central region indicated by the white ovals. The region was selected for each slice to comprise the region between the electrodes while avoiding partial volume effects in regions with rapidly varying fields. Each slice shows field enhancement due to the stronger current magnitude in the electrodes as well as in the tissue. The right column (b, d, and f) shows the difference after scaling the fields based on the overall current level to highlight changes in strong field regions. The anterior slice (a and b), where the electrodes were insulated, shows little to no difference in field pattern, particularly after correction for current level. The central slice (c and d) shows field enhancement between the electrodes, indicating stronger current in the tissue in the ablated region between the electrodes, which remains after accounting for the increased current level. The posterior slice (e and f) shows slight field enhancement between the electrodes, commensurate with the lower overall fields in that slice.

