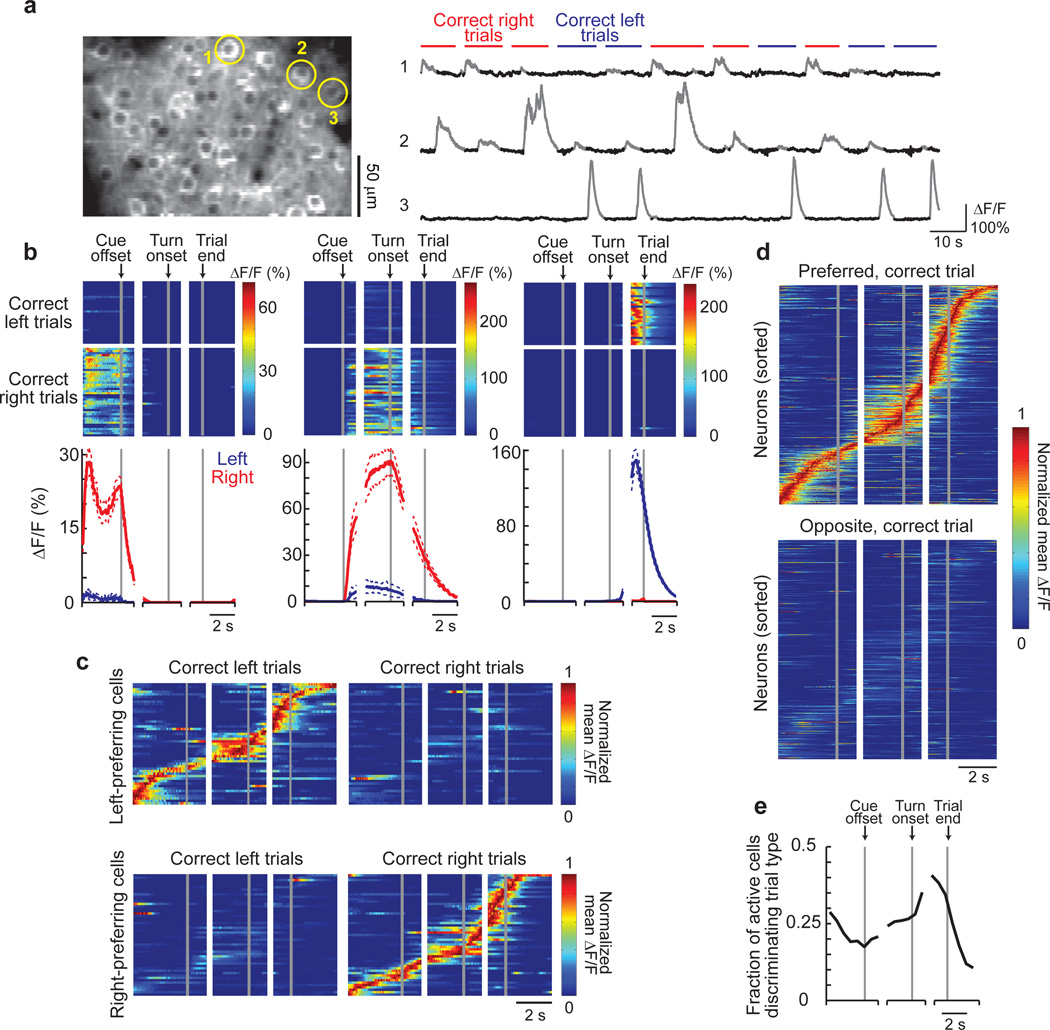
Left: Example image of GCaMP3-expressing neurons in layer 2/3. Right: Example fluorescence intensity traces (ΔF/F; gray portions indicate significant Ca2+ transients, Methods) for three example cells from the left panel on correct right (red) and left (blue) trials.
Activity patterns during the task for cells 1–3 from (a). Top: Color-coded ΔF/F traces for individual correct left and right choice trials. Each row is a single trial aligned to the cue offset, turn onset, and trial end. Bottom: Mean ΔF/F traces for correct right (red) and left (blue) choice trials. Dashed lines indicate mean ± sem.
Normalized mean ΔF/F traces for all the choice-specific, task-modulated cells (one cell per row) imaged in a single mouse and divided by left-preferring (n = 51) and right-preferring (n = 54) cells. Traces were normalized to the peak of each cell’s mean ΔF/F trace on preferred trials and sorted by the peak time. Some cells were imaged on different days and in different fields-of-view.
Same as in (c), except for all mice (n = 404 cells from 6 mice) on preferred and opposite trials.
Fraction of active cells with significantly different activity levels on right and left choice trials as a function of trial time.

