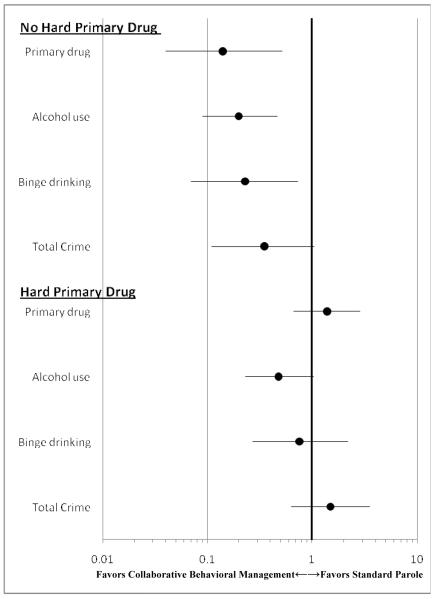
Figure 2. Forest plot of adjusted risk ratios for self-reported substance use and total crime over the 9-month follow-up, stratified by hard primary drug use.
From generalized estimated equation (GEE) models including effects for study site, self-reported frequency of use of the outcome variable prior to incarceration, log-transformed community-dwelling days, time, study condition, and the interaction of time and study condition.

