
Figure 3.
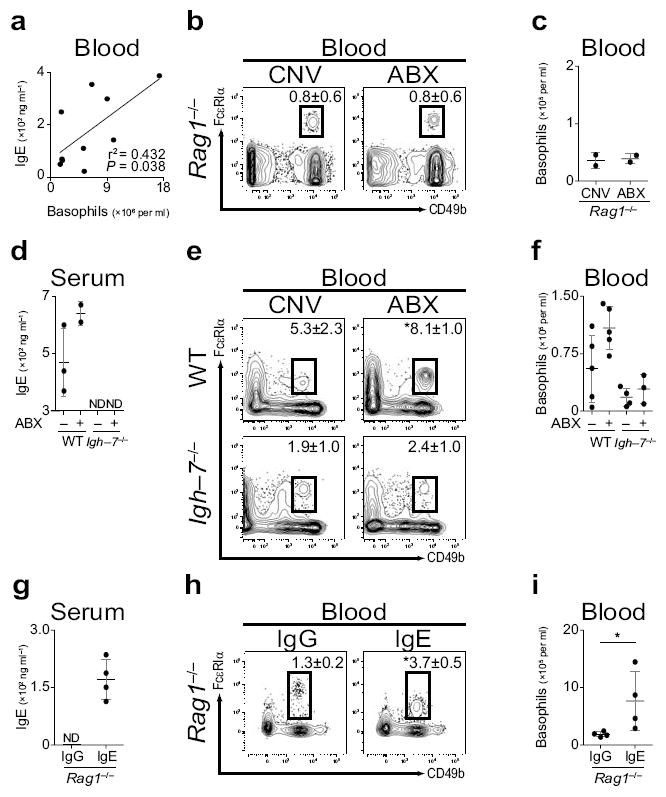
IgE correlates with circulating basophil populations in mice. (a) Statistical correlation of blood basophil number and serum IgE concentration (significance determined by linear regression analysis; r2 = 0.432; P ≤ 0.038). (b) Flow cytometric analysis of blood basophils from CNV or ABX Rag1−/− mice. Numbers adjacent to outlined areas indicate percent cells in each gate (CNV, n=4; ABX, n=5). Gated on CD3−, CD4−, CD8−, CD19−, CD117− cells. (c) Number of basophils per ml of blood from CNV or ABX Rag1−/− mice (CNV, n=2; ABX, n=2). (d) Serum IgE from CNV or ABX wild–type (WT) or Igh–7−/− mice as measured by ELISA (ND, not detected). (e) Flow cytometric analysis of blood basophils from CNV or ABX WT or Igh–7−/− mice (CNV–WT, n=5; ABX–WT, n=5; CNV–Igh–7−/−, n=4; ABX–Igh–7−/−, n=3). (f) Number of basophils per ml of blood from CNV or ABX WT or Igh–7−/− mice (CNV–WT, n=5; ABX–WT, n=5; CNV–Igh–7−/−, n=4; ABX–Igh–7−/−, n=3). (g) Serum IgE levels from IgG or IgE treated Rag1−/− mice as measured by ELISA (IgG, n=4; IgE, n=4; ND, not detected). (h) Flow cytometric analysis of blood basophils from IgG or IgE treated Rag1−/− mice (IgG, n=4; IgE, n=4). (i) Number of basophils per ml of blood from IgG or IgE treated Rag1−/− mice (IgG, n=4; IgE, n=4). Data representative of three or more independent experiments, results shown as mean ± s.d., significance determined by Mann–Whitney test unless otherwise indicated (*, P ≤ 0.05).