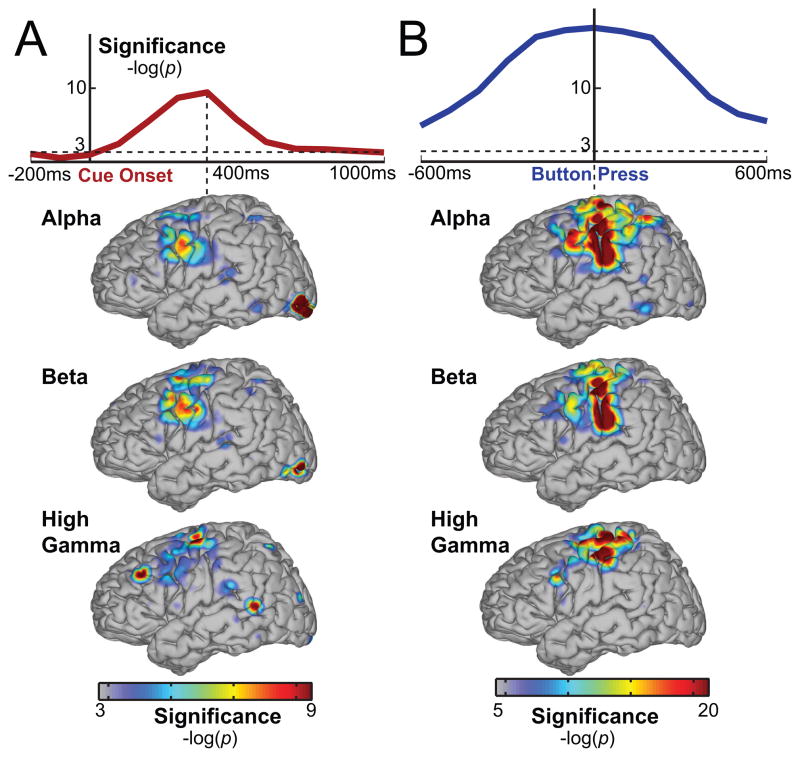
Figure 8.
(A) Top row: Temporal evolution of significance for decoding attentional engagement time aligned to cue onset and averaged across subjects. Bottom rows: Significance of cortical areas and spectral bands at the most significant time point (400 ms). (B) Temporal evolution of significance for decoding button press and cortical activations during button press.

