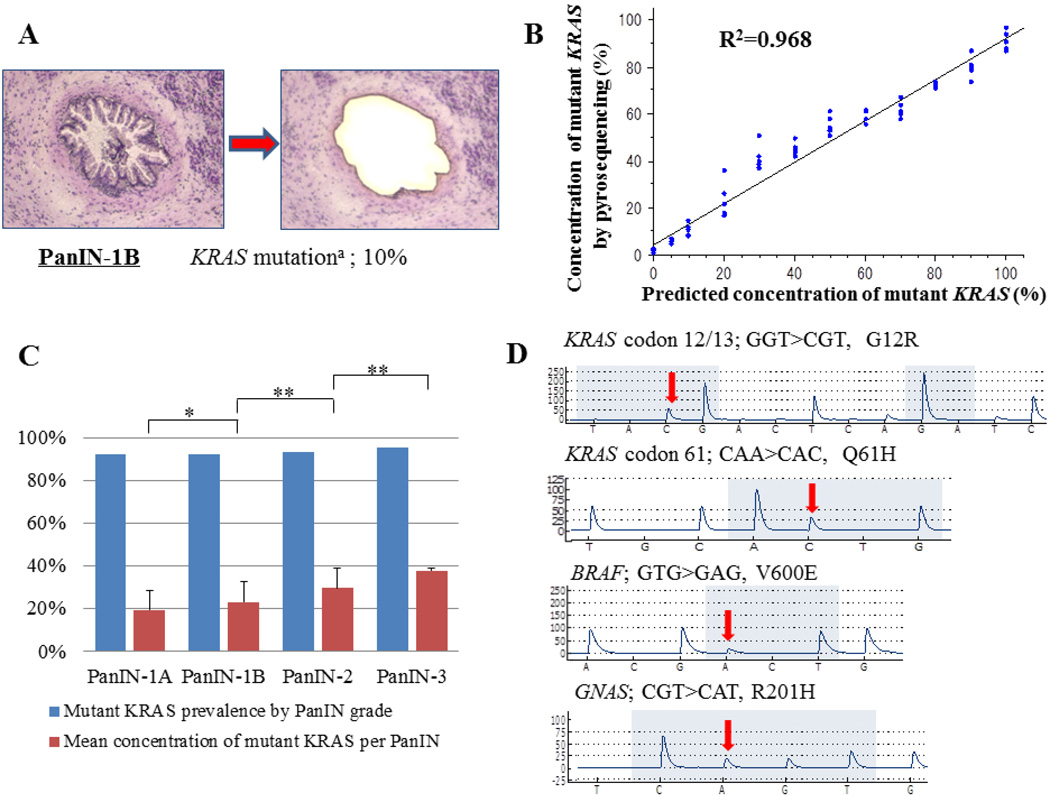
Figure 1.
(A) An example of a H + E stained PanIN before and after laser capture microdissection. Microdissection was performed at the duct epithelial cell borders to avoid contamination with stromal cells. (B) Scatter-plot graph of actual and predicted concentrations of mutant DNA by pyrosequencing. (C) Prevalence of KRAS codon 12 mutations and concentration of mutations per PanIN by grade of PanIN. KRAS codon 12 mutations were found in more than 92% of PanINs in every group. The average percentage of mutant KRAS alleles within a PanIN increased at each PanIN grade. (D) Representative pyrosequencing traces with mutant sequences highlighted by the arrows. * P<0.05, **P<0.001. a = Concentrations of mutant DNA by pyrosequencing.

