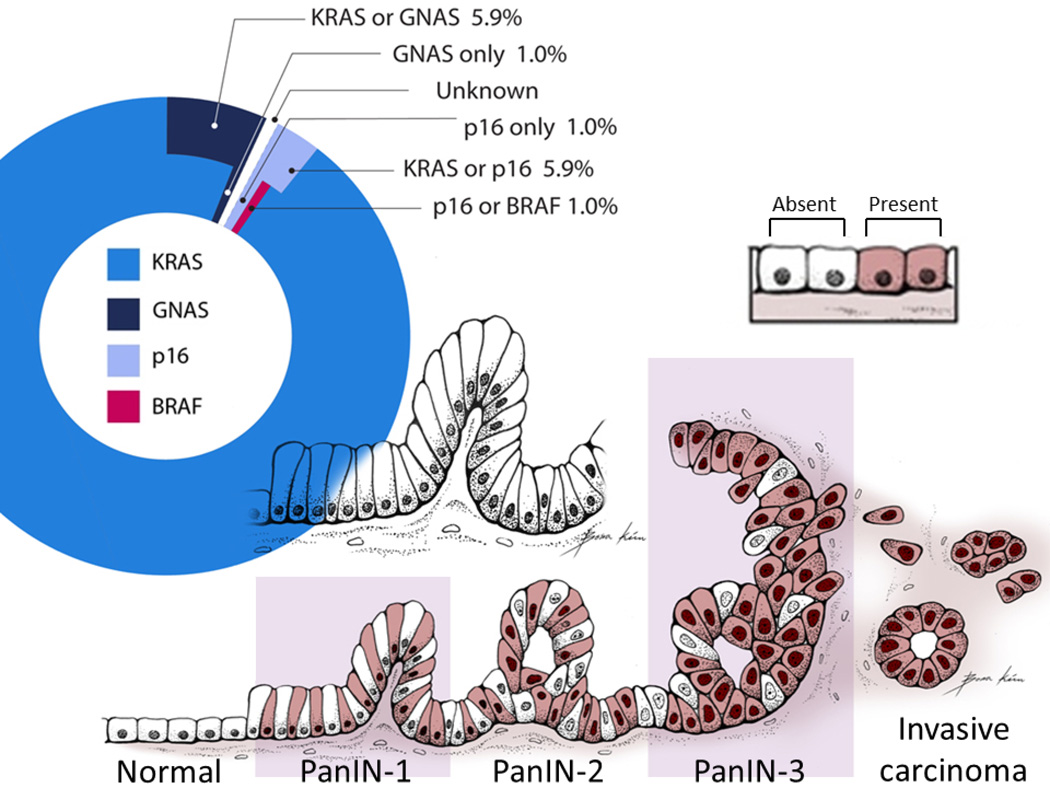
Figure 2. Initial mutations of PanIN-1 lesions.
The pie chart in the upper portion of the figure is indicates the percentage of mutations in each of the genes tested (KRAS, GNAS, p16, BRAF) identified in PanIN-1 lesions. For PanIN-1 lesions with more than one mutation, we could not determine which gene was mutated first. For example, a few PanIN-1 lesions had both a KRAS mutation and a GNAS mutation so the initial mutation in these PanINs was indicated as arising in either “KRAS or GNAS”.
The bottom portion of the figure is a schematic model illustrating the increasing percentage of mutant KRAS cells within PanIN lesions as they progress from a low-grade to a high-grade PanIN and to an invasive ductal adenocarcinoma, based on measurements of the average mutant KRAS concentrations per PanIN. Shaded cells (Present) represent PanIN cells with mutant KRAS, non-shaded cells (absent) represent PanIN cells without mutant KRAS (wild-type).
PanIN = pancreatic intraepithelial neoplasia.

