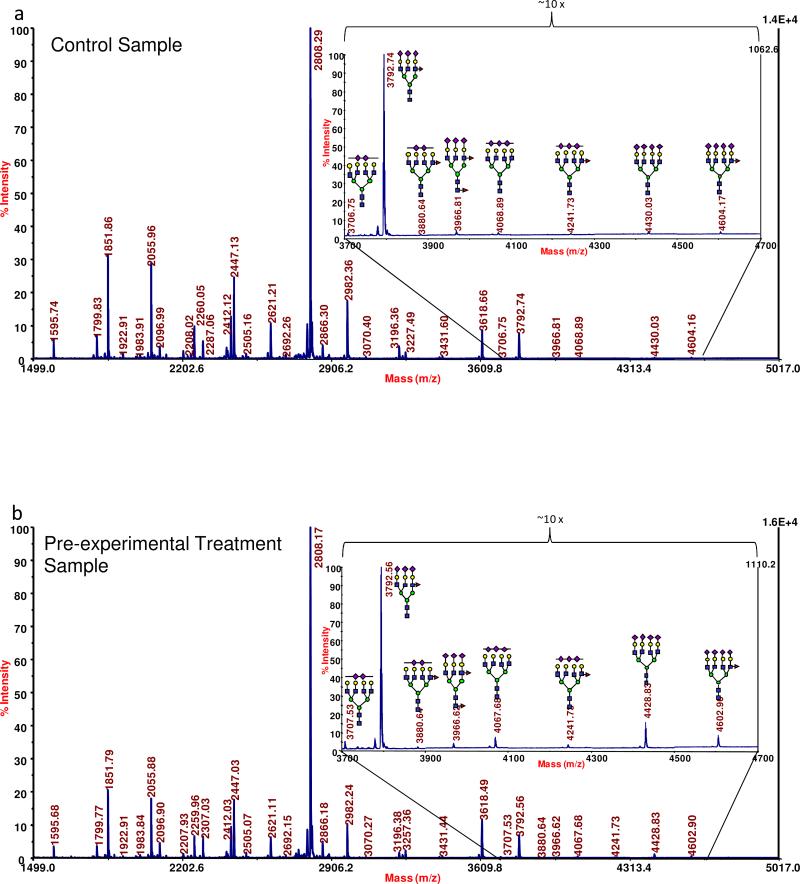
Figure 1.
A representative MALDI MS-based N-linked profile acquired for (a) a control individual, the high-mass region of the spectrum collected for a control individual is shown as the inset; (b) a baseline ovarian cancer patient, the inset depicts the high-mass region of the spectrum. Symbols: blue square, N-acetylglucosamine; green circle, mannose; yellow circle, galactose; purple diamond, N-acetylneuraminic acid; red triangle, fucose.

