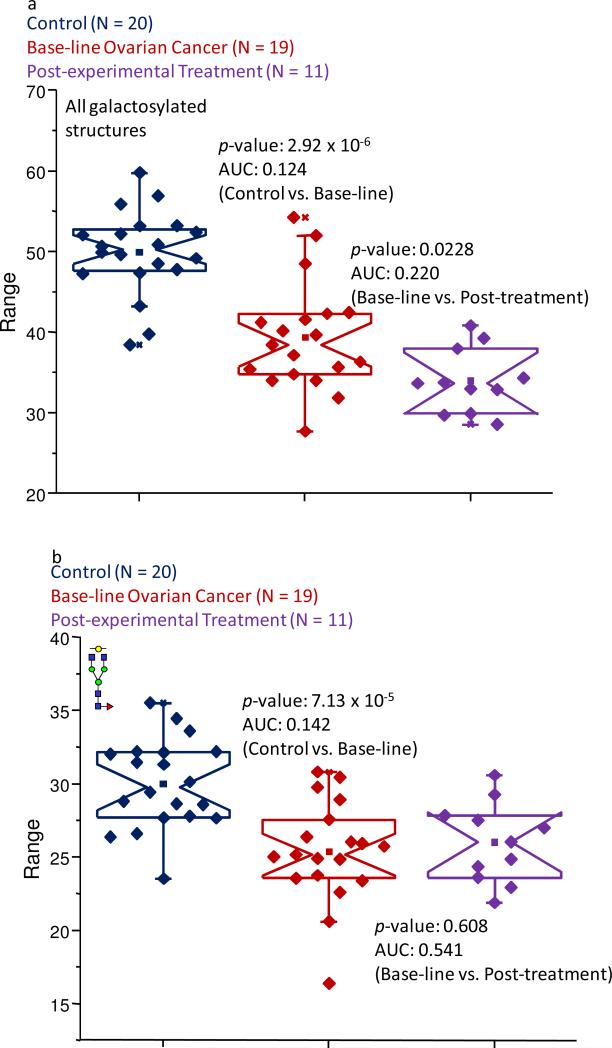
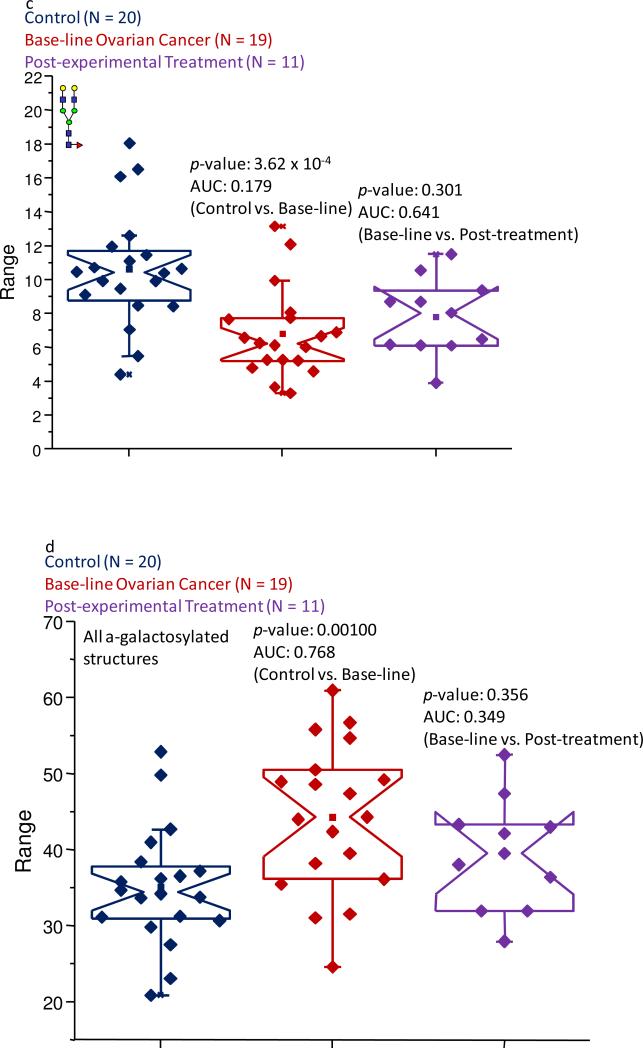
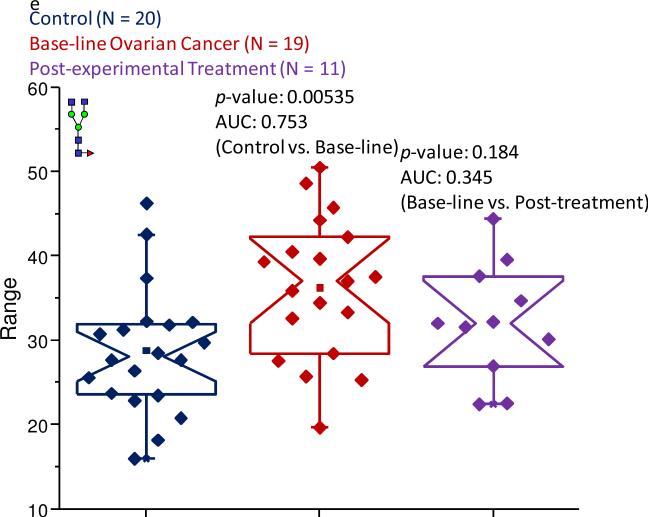
Figure 6.
Notched-box plots demonstrating (a) the overall decreased abundance of galactosylated structures in the baseline ovarian cancer and post-experimental treatment sample sets; (b) the decreased abundance of the mono-galactosylated biantennary structure due to the pathological condition; (c) the decrease level of the di-galactosylated glycan in the disease samples; (d) the increased abundance of the a-galactosylated structures in the pathological samples; and (d) the increased level of the core-fucosylated, a-galactosylated bi-antennary structure in the samples associated with the baseline ovarian cancer samples and the post-experimental treatment set. All of these subclasses and structures were derived from IgG. The symbols are the same as those described in Figure 1.


