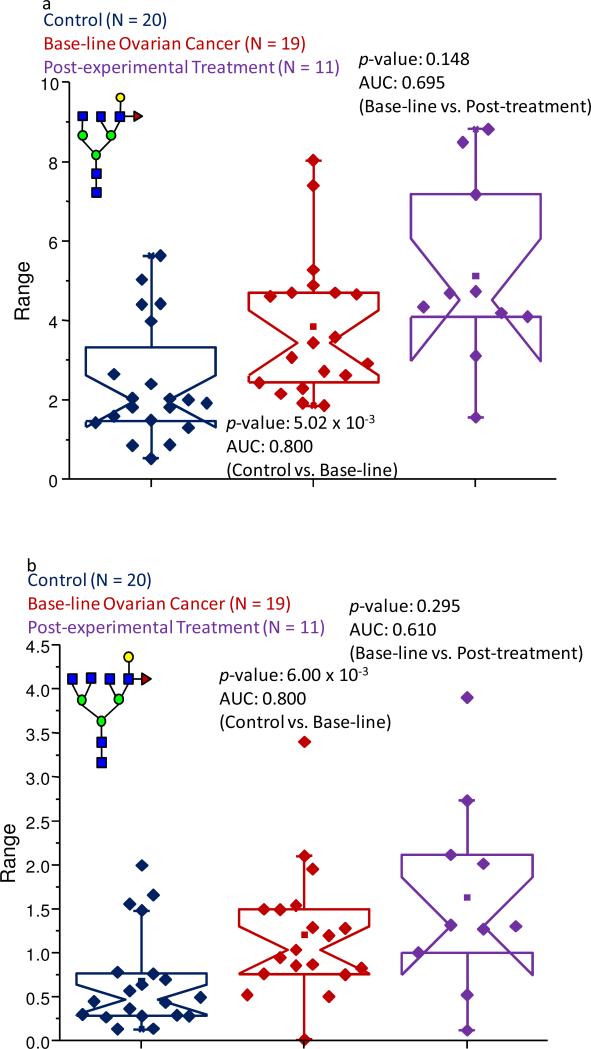
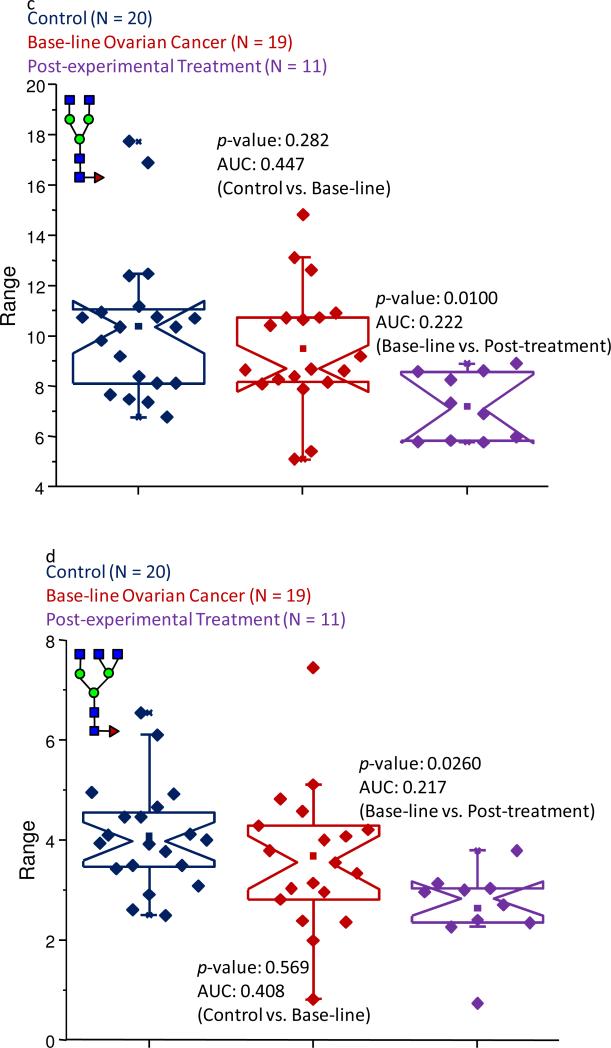
Figure 7.
Notched-box plots presenting changes in abundance levels of structures generated by the exoglycosidase digestion of glycans using a non-specific sialidase and a β1-4,6 galactosidase. The increased levels of outer-arm fucosylation are shown in (a) for the tri-antennary digestion product; and (b) for the tetra-antennary structure. Decreased levels of core fucosylation in the post-experimental treatment samples were observed for (c) the bi-antennary product; and (d) the tri-antennary structure. The symbols are the same as those described in Figure 1.


