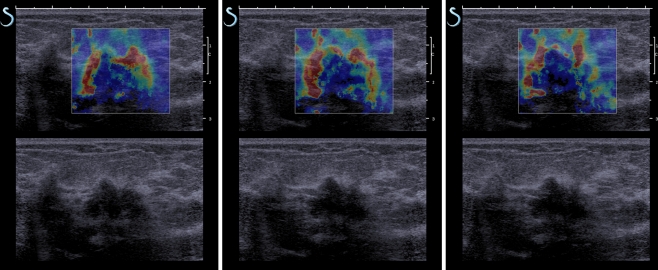
Fig. 1.
Three sequentially acquired Shearwave Elastography (SWE™) images of a breast cancer showing the small changes registered over time. The repeatability in this case was scored as “all images very similar”. The upper portion of each image shows the tissue elasticity as a colour overlay where red represents the highest stiffness and blue represents the lowest stiffness. The lower image shows the registered B-mode image

