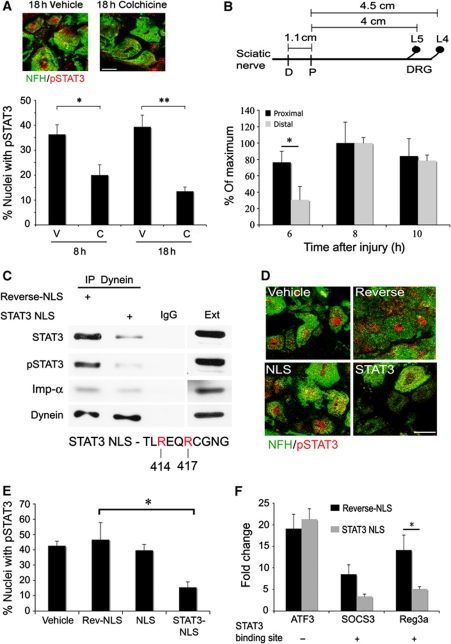
Figure 5.
Retrograde transport of activated STAT3 after injury. (A) Injection of colchicine (C, 100 μg) 1 cm proximal to the injury site in sciatic nerve (SN) reduced nuclear accumulation of pSTAT3 at the indicated post-injury time points in DRG neurons. Controls were injected with PBS vehicle (V). Quantification as for Figure 4E (average±s.e.m., n=3, *P<0.05, **P<0.01, scale bar 20 μm). (B) Influence of injury site location on the nerve on accumulation of pSTAT3 in DRG neuronal nuclei. The scheme shows average distances between the injury sites in sciatic nerve and the L4/L5 DRGs (D-distal injury, P-proximal injury). The fraction of DRG neurons with pSTAT3 concentrated in the nucleus after sciatic nerve proximal or distal injury is shown as percent of maximum after normalization to the 4-h time point (average±s.e.m., n=3, *P<0.05). (C) In all, 500 μg axoplasm from injured sciatic nerve (6 h) was subjected to dynein immunoprecipitation, in the presence of 50 μg reverse-NLS or STAT3-NLS peptide, followed by western blot analysis with antibodies against STAT3, pSTAT3, importin α, and dynein. Precipitation with an unrelated IgG serves as a control (n=3). For more details on the STAT3-NLS used, please see Supplementary Figure S5. (D, E) Injection of STAT3-NLS peptide to sciatic nerve inhibits accumulation of pSTAT3 in DRG neuronal nuclei after injury. In all, 250 μg of NLS, reverse-NLS, or STAT3-NLS peptide, or PBS vehicle alone, was injected to sciatic nerve, and L4/L5 DRGs were fixed 18 h later. DRG sections were stained for pSTAT3 and NFH, representative pictures are shown in (D) (scale bar 20 μm), and the fraction of DRG cells with concentrated pSTAT3 in the nucleus was quantified as shown in (E) (average±s.e.m., n=3, *P<0.05). (F) RNA was extracted from L4/L5 DRG 18 h after injection of STAT3-NLS or control reverse-NLS peptides to sciatic nerve concomitantly with a crush injury. Control RNA was extracted from the contralateral DRG. The RNA was reverse transcribed and qPCR was performed for the genes of interest. Results are normalized to β-tubulin and presented in fold changes versus control (average±s.e.m., n=3, *P<0.05). Figure source data can be found in Supplementary data.

