Figure 6.
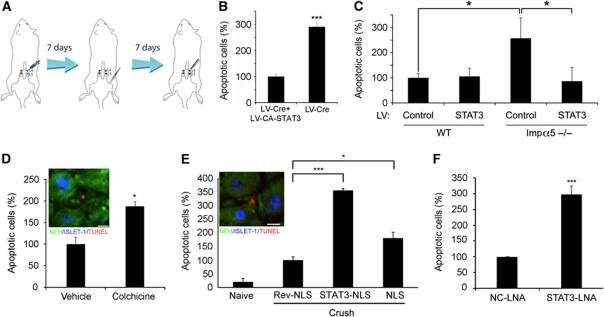
Axonal STAT3 promotes neuronal survival after nerve injury. (A) Schematic of lentivirus (LV) transduction protocol. A high titre LV of interest was injected to the L4 and L5 DRGs, and the animals were allowed 7 days for recovery and expression of the LV delivered gene product. Then sciatic nerve crush was performed, and 7 days afterwards the L4/L5 DRGs were excised, fixed, sectioned and stained for the neuronal markers NFH and ISLET-1 together with TUNEL staining for monitoring of cell death. (B) Expression of constitutively active (CA) STAT3 in DRG reduces neuronal death after SN injury in mice deprived of STAT3 in DRG. Reduction of STAT3 expression in L4/L5 DRG was achieved using the cre-lox system, by injection of LV expressing Cre recombinase to L4/L5 DRGs of floxed-STAT3 mice as described in (A). Co-infection with CA-STAT3 caused a three-fold reduction in the fraction of apoptotic cells (average±s.e.m., n=6, ***P<0.005). (C) Enhanced neuronal cell death in L4/L5 DRG of importin α5 KO mice is attenuated by LV-mediated expression of CA-STAT3 in the ganglia (average±s.e.m., n=4, *P<0.05). LV-GFP was used as a control. (D) Colchicine (100 μg) injection to rat SN concomitantly with lesion increased the fraction of TUNEL-positive neurons in the L4/L5 DRG 7 days later. Vehicle control is PBS. (E) Effects of injection of 250 μg of NLS, reverse-NLS or STAT3-NLS peptides concomitantly with SN lesion in rat on the fraction of TUNEL-positive neurons in the L4/L5 DRG 7 days later. Insets in (D) and (E) show representative images (scale bar 15 μm). (F) Effects of injection of 0.3 μg anti-STAT3 or negative control (NC) locked nucleic acid (LNA) into sciatic nerve 2 days before and then again concomitantly with lesion, followed by counts of TUNEL-positive neurons in the L4/L5 DRG 7 days afterwards. Similar results were obtained when monitoring cleaved caspase 3 instead of TUNEL (Supplementary Figure S10). Results in (D–F) are presented as percentage of the control treatments (average±s.e.m., n⩾3, *P<0.05, ***P<0.005).

