Figure 2.
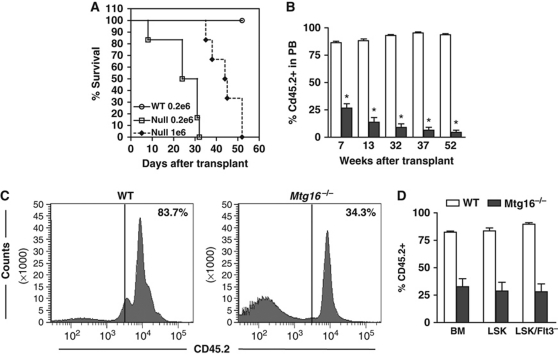
Inactivation of Mtg16 disrupts HSC functions. (A) Survival curves of a representative transplant experiment using 200 000 wild-type bone marrow (BM) cells (open circles), 200 000 Mtg16-null BM cells (open boxes), or 1 000 000 Mtg16-null bone marrow cells (filled diamonds). (B) Competitive repopulation assay where 90% control (empty bars) or Mtg16-null (filled bars) CD45.2+ BM cells were co-injected with 10% wild-type CD45.1+ cells. The contribution of each population to long-term reconstitution of the BM was assessed by flow cytometry using anti-CD45.1 and anti-CD45.2 to enumerate cells in the peripheral blood. Data are expressed as mean±s.e.m. at different times after transplantation. An unpaired two-tailed t-test indicated these differences (marked by an *) were statistically significant at all time points after transplantation (P<0.0001; n=5). (C) Flow cytometry analysis of whole BM to determine the percentage of CD45.2 that had repopulated the bone marrow 12 weeks after a competitive repopulation assay. A representative plot from an experiment performed in triplicate that is consistent with other biological replicates is shown. (D) Graphical representation of the quantification of CD45.2 cells residing in the BM and LSK or LSK/Flt3− compartments 12 weeks after competitive BM transplantation.

