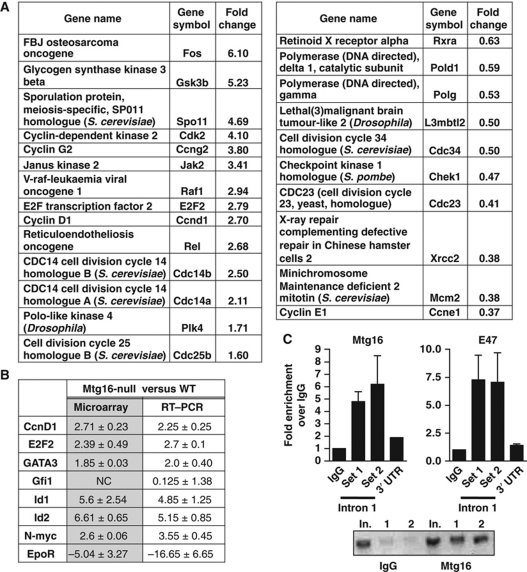
Figure 6.
Mtg16-null LSK cells have altered gene expression patterns. (A) Gene expression profiling of mRNA from LSK cells isolated from wild-type and Mtg16-null mice was analysed using cDNA microarrays. Panther ontology analysis was used to group genes into specific biological processes and representative genes associated with cell-cycle control with their relative expression levels when Mtg16 is deleted are shown. (B) Quantitative RT–PCR of selected genes was used to validate the microarray studies. (C) Mtg16 associates with the first intron of E2F2. Chromatin immunoprecipitated with the either control IgG or anti-Mtg16/Eto2 from lysates of MEL cells was amplified with two sets of primers (Set 1 and Set 2) that encompass an E2A binding site in the first intron of E2F2, or as a control, the 3′ untranslated region (UTR) of E2F2 using quantitative PCR. Graph shows the level of signal relative to IgG set to ‘1’. The panel at the right shows ChIP using anti-E47 with the same E2F2 first intron primers. The ethidium bromide-stained agarose gel shows a representative PCR stopped after 30 cycles; In., input; 1 and 2 designate the duplicate PCR samples from the ChIP reaction using primer set #2 flanking the E2A binding site.

