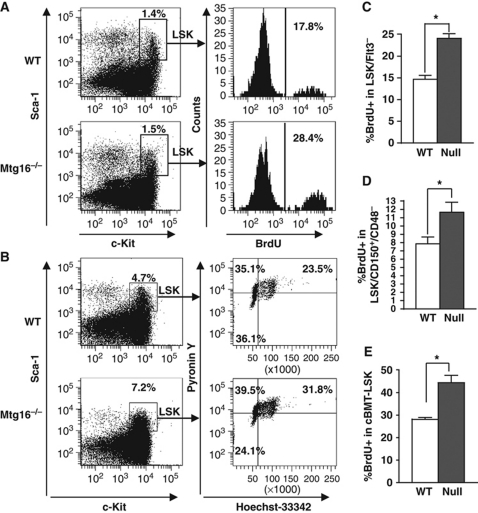
Figure 7.
Inactivation of Mtg16 leads to a decrease in the number of quiescent LSK cells. (A) Cell-cycle status of LSK cells was analysed using BrdU. A representative FACS plot from an experiment performed with five mice that is consistent with other biological replicates is shown. (B) Cell-cycle status of LSK cells was analysed with the DNA dye Hoechst 33342 (HO) and the RNA dye Pyronin Y (PY). A representative plot from an experiment performed in triplicate that is consistent with other biological replicates is shown. (C) Quantification of the percentage of LSK/Flt3− cells in S phase using BrdU incorporation as described in (A), but incorporating anti-Flt3. Data are expressed as mean±s.e.m. and are consistent with other biological replicates. *An unpaired two-tailed t-test yielded P<0.0001; n=6. (D) Quantification of the percentage of LSK/CD150+/CD48− cells in S phase using BrdU incorporation as described in (A). Data are expressed as mean±s.e.m. and are consistent with other biological replicates. *An unpaired two-tailed t-test yielded P=0.025; wild type, n=7; Mtg16-null, n=8. (E) Quantification of the number of LSK cells in the S phase 5–6 weeks after competitive repopulation was analysed using BrdU as described in (A). Data are expressed as mean±s.e.m. and are from biological replicates. *An unpaired two-tailed t-test yielded CD45.2+, LSK BrdU+, P=0.0069; wild type, n=4; Mtg16-null, n=8.

