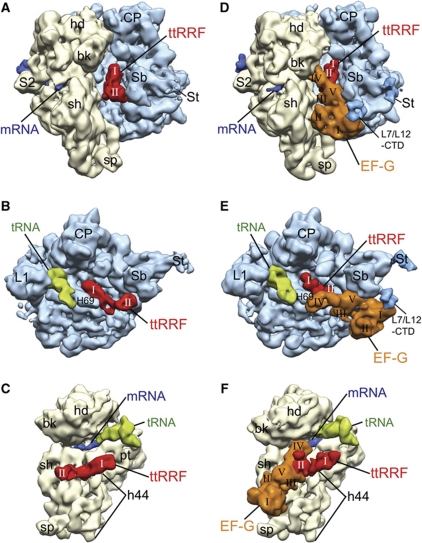
Figure 1.
Segmented cryo-EM maps of the PoTC·ttRRF and PoTC·ttRRF·EF-G·GDP·FA complexes. (A–C) The PoTC·ttRRF complex (complex 1): (A) The 70S ribosome (yellow, 30S subunit; and blue, 50S subunit) is viewed from the tRNA entry side, with strong densities for both domains (I and II) of ttRRF (red) clearly visible in the intersubunit space (see also Supplementary Figure S1A for a stereo viewing); (B) the same map is shown from the 50S interface side, where the 30S subunit has been computationally removed to reveal densities corresponding to ttRRF (in position P1/IIa) and deacylated tRNA (green, in the P/E site); and (C) the same complex is shown along with density corresponding to mRNA (dark blue) from the 30S interface side, without the 50S subunit. (D–F) The PoTC·ttRRF·EF-G·GDP·FA complex (complex 2), shown in matching views with (A–C): (D) Densities for both ttRRF and ecEF-G can be seen in the intersubunit space, with both domains of ttRRF and all five domains (I–V) of EF-G (orange) readily identifiable (see also Supplementary Figure S1B for a stereo viewing). Position occupied by domain II of ttRRF in (A–C) is now occupied by domain V of EF-G; (E) the same complex is shown from the 50S interface side (without 30S subunit) to reveal densities corresponding to ttRRF (in intermediate position Pi), EF-G, and deacylated tRNA (in the P/E and E sites); and (F) the same complex shown along with density corresponding to mRNA (dark blue; see Supplementary Figure S3 for complete mRNA density) from the 30S interface side, without the 50S subunit. A marked shift in RRF position can be seen when compared with the RRF position in (C). Landmarks of the 30S subunit: bk, beak; hd, head; pt, platform; sh, shoulder; sp, spur; h44, 16S rRNA helix 44; and S2, protein S2. Landmarks of the 50S subunit: CP, central protuberance; L1, protein L1 stalk; L7/L12-CTD, C-terminal domain of protein L7/L12; Sb, stalk base (protein L11 region); St, L7/L12 stalk; and H69, 23S rRNA helix 69. In (D, E), densities corresponding to extended St and L7/L12-CTD are shown at slightly lower threshold values than the threshold value used for displaying the rest of the 50S subunit.

