Figure 5.
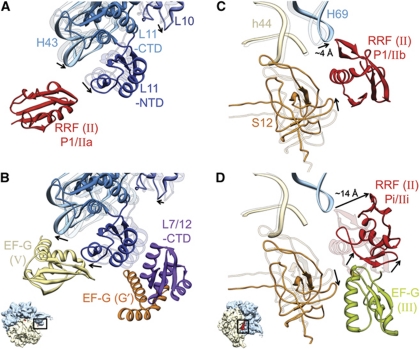
Movements of domain II of RRF, and conformational changes of ribosomal components that interact with RRF and EF-G. Fitted atomic structures of the ribosomal components in two functionally relevant regions are shown. (A, B) The L11 Sb region; and (C, D) the bridge B2a region, shown along with protein S12. In each panel, fitted structures of two functional states are shown. In (A, C), the ribosomal components of the PoTC complex are shown as semitransparent ribbons, while those of complex 1 are shown as solid ribbons. Similarly, in (B, D), ribosomal components of complex 1 are shown as semitransparent ribbons, whereas those of complex 2 are shown as solid ribbons. Arrows point to movements in the ribosomal components and RRF. Domain II of RRF in specified positions (A, C, D), domains V and G’ of EF-G (B), and domain III of EF-G (D) are also shown. Since only a weak density for domain II of RRF in P1/IIb configuration was observed in this study, its corresponding position in (C) is based on previous studies (Agrawal et al, 2004; Pai et al, 2008). The position of L7/L12-CTD shown in (B) is similar to that derived in previous cryo-EM (Datta et al, 2005) and X-ray crystallographic (Gao et al, 2009) studies (also see Supplementary Figure S11). Thumbnails to lower left of (B, D) depict the orientations of the 70S ribosome in (A, B) and (C, D), respectively.

