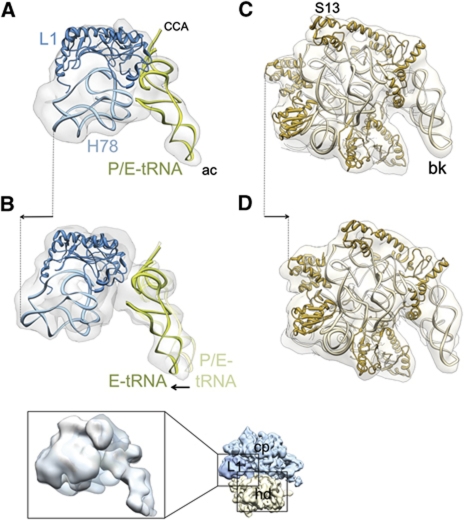
Figure 6.
Conformational changes of the ribosome and tRNA movement due to binding of RRF and EF-G. Each structure was aligned, using the core portion of the 50S subunit of the cryo-EM maps as the main guide. (A, B) Movement of the L1 stalk (light blue, rRNA helices 77 and 78; dark blue, protein L1) and tRNA (green) during transition from (A) complex 1 to (B) complex 2. (C, D) Movement of the 30S subunit head (light brown, 16S rRNA; dark brown, 30S subunit head proteins) during transition from (C) complex 1 to (D) complex 2. Cryo-EM densities are shown as semitransparent grey. In all panels, the ribosomes are viewed from the top, in an overall orientation depicted in the thumbnail at the lower right. In (A, B), only the L1 stalk region (corresponding to left boxed area on the thumbnail) of the 50S subunits, and in (C, D), only the head portion (corresponding to lower right boxed area on the thumbnail) of the 30S subunits are shown (see also Supplementary Figure S7 for the overall conformational changes). The inset shown below (B) depicts the split densities for tRNA anticodons between the P (semitransparent) and E (solid) sites in complex 2. Arrows indicate major movements (see Supplementary Figure S8 for stereo viewing of the tRNA movement). Landmarks: ac, anticodon end; CCA, acceptor end; H78, helix 78 of the 23S rRNA; S13, small ribosomal subunit protein S13. The rest of the landmarks of the ribosomal subunits are the same as in Figure 1.

