Figure 4.
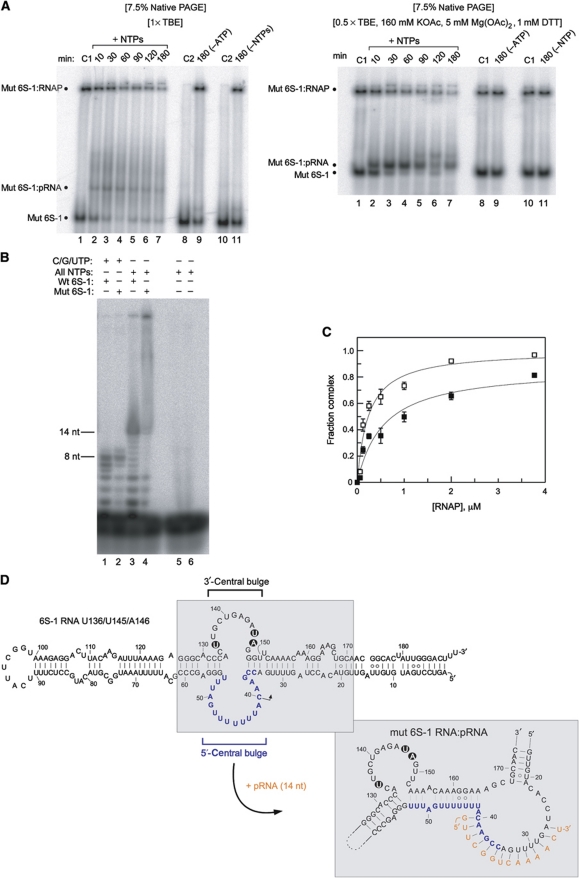
Functional analysis of the U136/U145/A146 mutant 6S-1 RNA unable to form a hairpin in the 3′-portion of the central bulge. (A) 5′-Endlabelled 6S-1 RNA was incubated with σA-RNAP in the presence of NTPs for different time periods as in Figure 2A. Samples were then either loaded on a 7.5% native PAA gel using 1 × TBE as electrophoresis buffer (left panel) or 0.5 × TBE, 160 mM KOAc, 5 mM Mg(OAc)2, 1 mM DTT, pH 8.6 (right panel) as electrophoresis buffer. Lanes C1: samples incubated for 180 min at 37°C in the absence of NTPs; lanes C2: as lanes C1 but without RNAP. For further details, see legend to Figure 2. (B) In vitro transcription was conducted as in Figure 1A, comparing wt (wt 6S-1) and U136/U145/A146 mutant 6S-1 RNA (mut 6S-1) as template; C/G/UTP, NTP mixture lacking ATP. For further details, see legend to Figure 1A. (C) Binding of 5′-endlabelled wt 6S-1 RNA (open squares) and U136/U145/A146 mutant 6S-1 RNA (filled squares) to the σA-RNAP holoenzyme, based on experiments as shown in (A) (right), but in the absence of NTPs (see also Beckmann et al, 2011). Apparent Kd values, based on two independent experiments, were 0.24±0.06 μM for wt 6S-1 RNA and 0.56±0.17 μM for the mutant 6S RNA, as derived from non-linear regression analysis using the equation for a single ligand binding site. Errors, standard errors of the mean (s.e.m.); some error bars are small such that they are masked by the symbol. Similar binding curves were obtained by 7.5% native PAGE in 1 × TBE buffer. The experimental end point for complex formation is lower for the mutant versus wt RNA, suggesting that the fraction of 6S-1 mutant conformers that are unable to bind to RNAP is increased relative to wt 6S-1 RNA. (D) Model of the mutant 6S-1 RNA structure before and after the pRNA-induced structural rearrangement. The three base exchanges are highlighted.

