Figure 7.
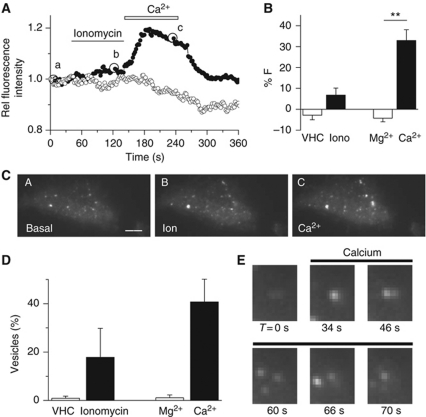
High intracellular Ca2+ mobilizes GFP–CYP46A1 towards the plasma membrane. (A) Relative change in the GFP–CYP46A1 fluorescence intensity as measured using Total Internal Reflection Microscopy (TIRF) after the addition of ionomycin and Ca2+ (black). For the negative controls (white), DMSO (vehicle) and Mg2+ were applied. (B) Average increase in fluorescence in the GFP–CYP46A1-expressing cells after different stimuli. (C) TIRF images of an HEK293T cell that expressed GFP–CYP46A1 at the time points indicated in (A) (a, before; b, after exposure to 0.5 μM ionomycin; c, after addition of 2 mM Ca2+). The scale bar indicates 4 μm. (D) Percentage of increase in the vesicle count following exposure to the indicated stimulus. (E) TIRF images of a GFP–CYP46A1-expressing HEK293T cell before (t=0) and during external Ca2+ application (**P<0.002, Student's t-test).

