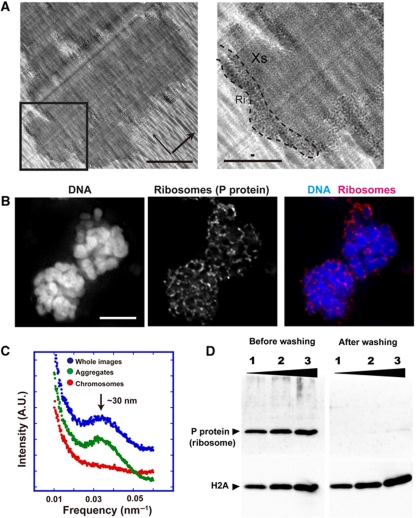
Figure 2.
Ribosome aggregates around chromosomes. (A) Cryo-EM image of the chromosome clusters (cross-sections). Many black dots were observed on the chromosome surface. Note that knife marks (thick arrow) and compression marks (thin arrow) were observed. Bars indicate 1 μm. An enlarged image of the region outlined with a box is depicted on the right. A black dot region is surrounded by a broken line (Ri). A chromosome part is marked as ‘Xs’. Long and short bars indicate 0.5 μm and 30 nm, respectively. (B) Immunostaining with anti-P antibody against a ribosomal component suggested that the peripheral black dots were ribosome aggregates (Uchiumi et al, 1990). DNA (DAPI), a ribosome and merged images of two chromosome clusters are shown. Bar indicates 10 μm (see also (D) and Supplementary Figure S3). (C) Power spectrum (Fourier transform) analyses of the aggregated regions, the chromosome regions and whole cryo-EM images. A 30-nm peak (arrow) was seen in the aggregated region (green dots) and whole images (blue dots). (D) Ribosome removal was verified by western blotting (Uchiumi et al, 1990).

