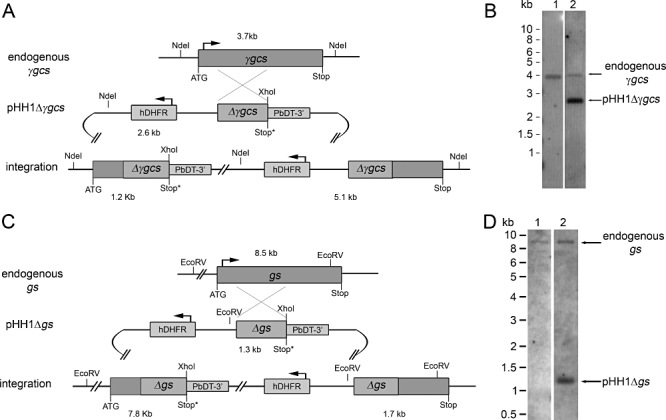
Figure 1.

Gene disruption of γgcs and gs. A. Schematic representation (not to scale) of the endogenous γgcs locus, the pHH1Δγgcs plasmid and the recombined γgcs locus following single cross-over recombination and integration of the plasmid. NdeI and XhoI restriction sites and the sizes of the resulting fragments are indicated. The plasmid contains a fragment of γgcs truncated at both 5′ and 3′ ends (Δγgcs) and a human dihydrofolate reductase selectable marker cassette (hDHFR). Recombination between plasmid and endogenous locus leads to a pseudo-diploid locus with two non-functional copies of the gene, one truncated at the 3′ end upstream and one truncated at the 5′ end downstream of the hDHFR cassette. B. Southern blot analysis of DNA isolated from parasites transfected with pHH1Δγgcs after two drug selection cycles (lane 2) in comparison with non-transfected wild-type parasites (lane 1). No bands indicating integration at 1.2 kb and 5.2 kb are visible in lane 2, only the 2.6 kb plasmid band and the 3.7 kb band corresponding to the endogenous γgcs locus. C. Schematic representation of the endogenous gs locus, the pHH1Δgs plasmid and the recombined gs locus following integration of the plasmid by single cross-over. Restriction sites for EcoRV and XhoI are indicated as well as the sizes of the expected DNA fragments. The pHH1Δgs plasmid contains a insert homologous to gs but lacking the 5′ and 3′ ends (Δgs) and a hDHFR selectable marker cassette. Integration of the plasmid causes the formation of a pseudo-diploid locus containing two non-functional copies of gs, the upstream copy being truncated at the 3′ end and the downstream copy being truncated at the 5′ end. D. Southern blot analysis of DNA isolated form parasite lines transfected with pHH1Δgs after two drug selection cycles (lane 2) in comparison with wild-type parasites (lane 1). No integration specific bands at 7.8 kb and 1.3 kb are visible in the DNA from the transfected parasite line. The endogenous gs specific band is visible in both wild-type and transfected parasites at 8.5 kb. In addition, a 1.3 kb band corresponding to the plasmid is visible in the transfected parasites.
