Figure 5.

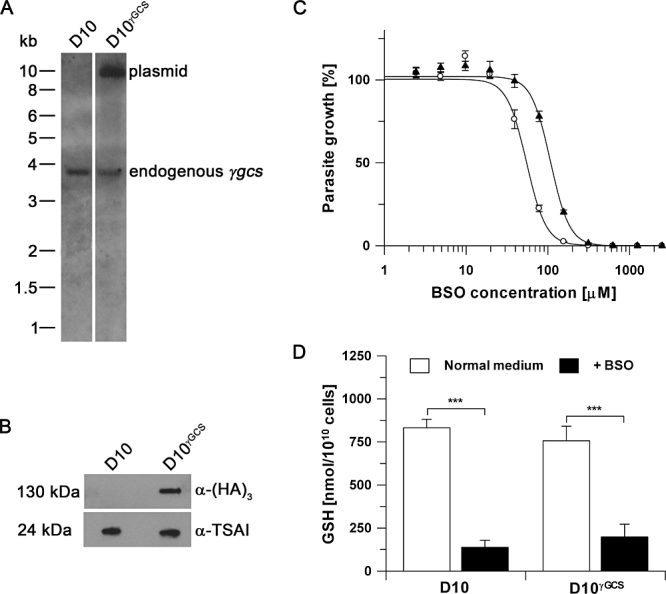
Episomal expression of γGCS-(HA)3 leads to increased BSO resistance. A. Southern blot analysis of wild-type D10 parasites (lane 1) in comparison with D10γGCS transfected with expression plasmid pCHD-γgcs(HA)3 (lane 2). The 3.9 kb band corresponding to endogenous γgcs and the 9.9 kb band diagnostic for the plasmid are indicated. B. Western blot analysis with anti-(HA)3 antibody (mouse, 1:1000) confirmed expression of γGCS-(HA)3 in D10γGCS. As a loading control an anti-P. falciparum 1-Cys peroxiredoxin antibody (α-TSAI, rabbit 1:120 000) was used. C. The BSO IC50 for wild-type D10 (○) was significantly lower (58.0 ± 2.2 µM) than for D10γGCS (▴, 111.2 ± 11.1 µM) parasites expressing γGCS-(HA)3 (P < 0.001, unpaired Student's t-test). Data represent means of three independent determinations, each done in duplicate. Error bars represent SD. D. GSH levels in D10 and D10γGCS under normal growth conditions and after incubation with 50 µM BSO for 2 h. Results represent means ± SEM of 3 to 5 independent determinations. There were no significant differences of GSH levels found between D10 (832 ± 50 nmol/1010 cells) and D10γGCS parasites (757 ± 85 nmol/1010 cells) grown in normal culture medium. Exposure to BSO significantly decreased GSH levels in both D10 and D10γGCS to 138 ± 41 and 199 ± 74 nmol/1010 cells respectively. Statistical analyses were performed using one-way ANOVA and Newman–Keuls post test (***P < 0.001).
