
Figure 6.
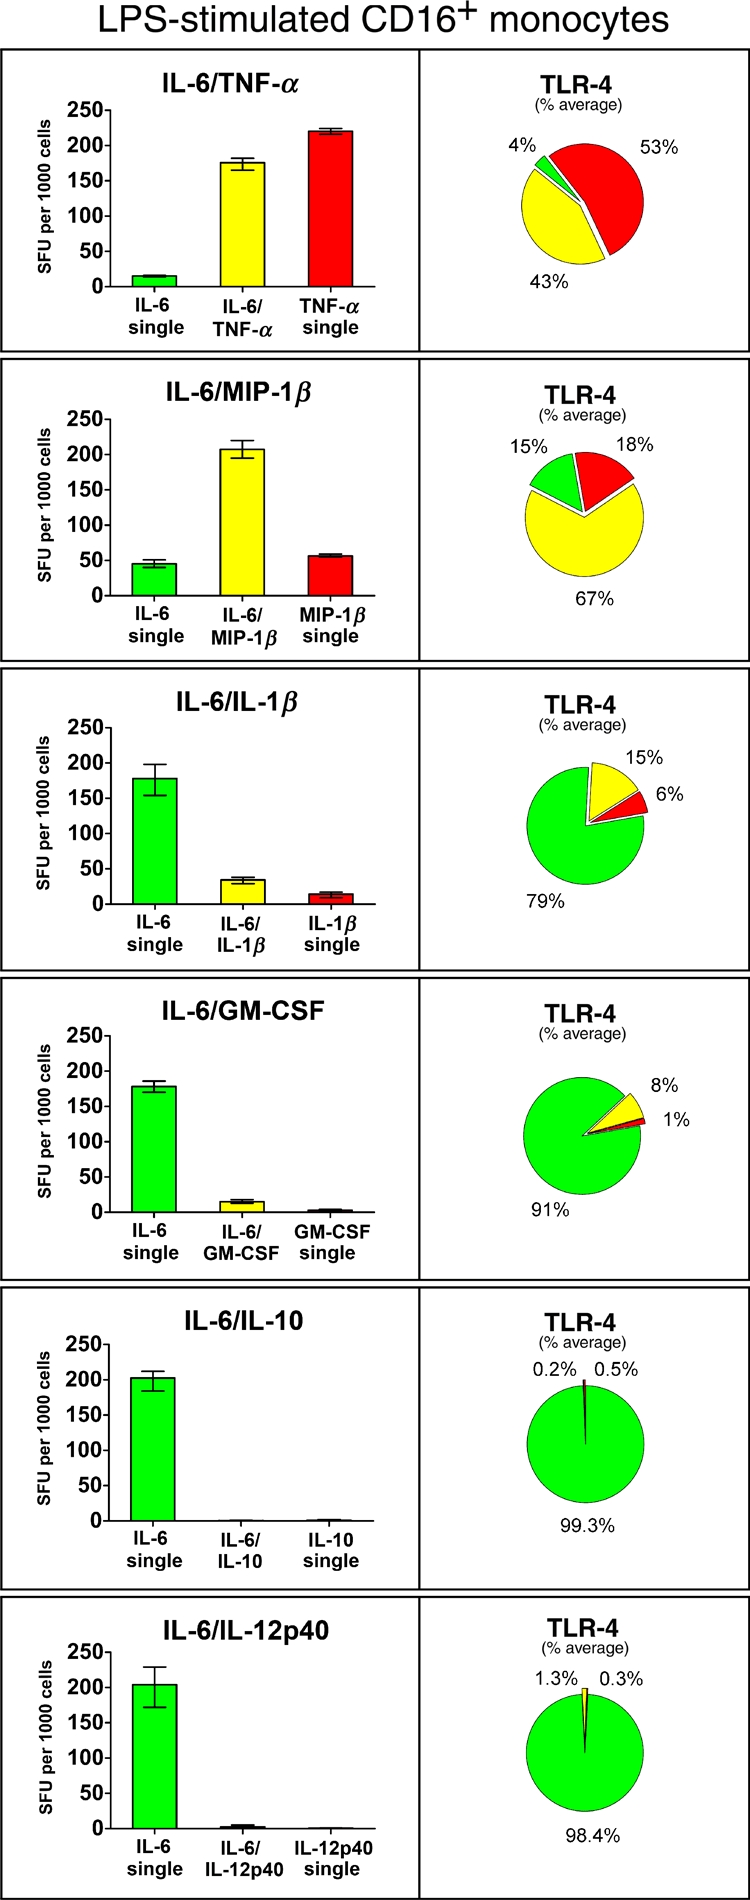
FluoroSpot analysis of cytokine co-secretion by lipopolysaccharide (LPS)-stimulated CD16+ monocytes. Purified CD16+ monocytes (1000 cells/well) were incubated for 20 h in FluoroSpot plates and analysed for the co-secretion of IL-6/TNF-α, IL-6/MIP-1β, IL-6/IL-1β, IL-6/GM-CSF and IL-6/IL-10, IL-6/IL-12p40 in response to LPS. Values represent the mean ± range of triplicates. Pie charts show the average percentage of LPS-activated CD16+ monocytes secreting either one of the cytokines or both. Monocytes cultured in medium alone are not shown but contained few cytokine-secreting cells (<52 spots for TNF-α, <22 spots for IL-6, <14 spots for MIP-1β, <3 spots for IL-1β, GM-CSF, IL-10 and IL-12p40). Similar results were obtained in two separate experiments.